Environment
01
We recognize that safeguarding the environment and adapting to climate change offer a meaningful opportunity to transform our operations and strengthen our positive contribution. By conducting climate-related risk assessments, we can better shape our strategy, guide investment decisions, and prioritize actions that enhance performance and resilience, ensuring our operations are managed with a clear, risk-aware approach.
Material Topics
- Emissions
- Waste Management

Goals 2028
Status: 13 out of 19 environmental
goals have been embedded in 2025.

SDGs
Climate-Related Risks and Policies
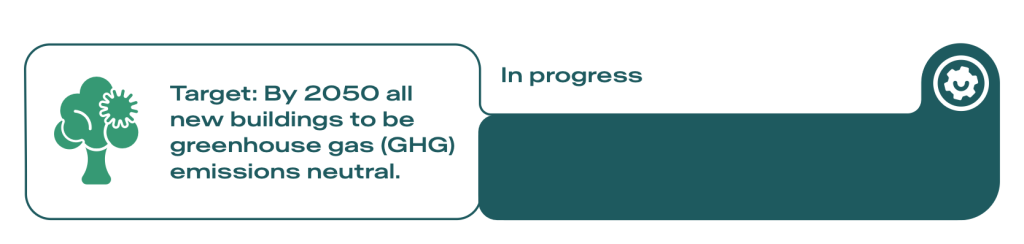
Danaos recognizes the importance of addressing climate change through a structured and transparent approach. In line with the recommendations of the Task Force on Climate-related Financial Disclosures (TCFD), we categorize, manage and report both physical and transition climate-related risks. Our long-term climate ambition remains the achievement of greenhouse gas (GHG) emissions neutrality by 2050, while pursuing opportunities to attain net-zero emissions earlier, subject to technological maturity and shipyard slot availability.
Over the past year, Danaos has continued to implement a wide range of energy-efficiency measures and has advanced the use of tools such as Internal Carbon Pricing to enhance environmental impact assessments and drive investment decisions. Our disclosures remain aligned with the TCFD framework to ensure that our stakeholders have clear insight into the Company’s climate strategy, risk management and long-term transition pathway.
Climate-scenario analysis, incorporating SSP1-2.6 and RCP 8.5, continues to inform our strategic planning. Based on these scenarios, Danaos has invested in automated systems for advanced sea routing and passage plan control across the entire fleet. We have further introduced advanced mooring force calculation software paired with targeted employee training to safeguard port operations. At the same time, we follow regulatory and technical developments closely, particularly the forthcoming structural rules expected from the International Association of Classification Societies (IACS), which are relevant to the sustainability and resilience of newbuild vessels.
Throughout the years, we have experienced disruptions caused by supply shortages from major lubricant and additive suppliers affected by hurricane-related infrastructure damage. To address this risk, we enhanced our consumables management policy by optimizing onboard inventory levels and deploying smart monitoring and alerting systems through our WAVES data analytics platform to ensure uninterrupted vessel operations. We further improved resilience by diversifying both suppliers and supply ports. To mitigate operational delays associated with prolonged anchorage due to extreme weather—such as coastal flooding, high winds and thunderstorms—we invested in advanced low-friction hull coatings to support longer idling periods and adjusted our provisions management strategy accordingly. These actions reinforce the resilience of our supply chain and reflect industry best practices in climate-related operational risk management.
Our Head office, which represents our principal land-based asset, is considered to have low exposure to physical climate impacts. Nonetheless, our business continuity strategy incorporates a backup operational framework located in another country in the hypothetical case of severe disruption. Remote work capabilities, enhanced through previous business continuity responses, provide additional assurance of operational continuity.
Danaos’ decarbonization strategy, guided by our Low Carbon Transition Plan (LCTP), focuses on a dual pathway: maximizing the operational efficiency of the existing fleet while investing in fleet renewal through the acquisition of ECO second-hand vessels and the construction of newbuildings capable of accommodating green fuels in the future. We anticipate that the ambitious SSP1-1.9 pathway aligned with the Paris Agreement’s 1.5°C objective will gain relevance, and we are actively exploring pathways to align our targets with the Science Based Targets initiative (SBTi), acknowledging the challenges that must be addressed. The LCTP incorporates the IMO’s decarbonization targets and reflects the IEA Sustainable Development Scenario’s trajectory toward achieving the Paris Agreement’s goal.

In strengthening our decarbonization agenda, we adopted stricter emissions-reduction targets, committing to a 50% reduction in carbon intensity by 2030 relative to 2008 levels and maintaining our long-term net-zero commitment for 2050.
Our LCTP articulates the main aspects of our environmental strategy in:
- Maximizing the efficiency of the existing fleet: Our investment in energy efficiency and Internal Carbon Pricing (ICP) tools demonstrates a strategic approach to emissions reduction and cost optimization. These tools enhance data-driven decision-making and sustainability impact assessments. Recognizing the limitations of energy efficiency improvements on the existing fleet underscores the importance of fleet renewal and exploring alternative fuels.
- Cooperating closely with our clients on a transparent data-sharing basis aiming to optimize the vessel trade route through an advanced leg analysis methodology, developed in-house.
- Working on the prevention of power penalty development through advanced performance monitoring tools: We try to achieve the maximum engagement of our people in this process. By emphasizing real-time performance evaluation and proactive corrective actions, we’re ensuring both operational efficiency and long-term sustainability. In this respect, we invest in advanced performance-monitoring tools, crew engagement and training on energy efficiency best practices, while we encourage a data-driven culture where crew actively contributes to performance monitoring.
- Green fuel readiness and fleet renewal, ensuring Danaos is well prepared for the maritime energy transition.
In the scope of Danaos disclosure about the application of TCFD framework in the management of climate-related risks, a comprehensive TCFD-aligned gap analysis and a detailed assessment of climate-related risks and opportunities was performed. In Danaos, we have assessed climate-related risks, identified their potential impacts and developed response mechanisms to mitigate these challenges.
These risks are categorized in transition risks (policy and legal, technology, market and reputation) and physical risks (acute and chronic climate impacts).
Transition risks, including regulatory changes such as the EU ETS, FuelEU Maritime and potential IMO CII-related penalties, are managed through emissions monitoring, data transparency and continued fleet efficiency upgrades. Technology-related risks are mitigated through investment in digital systems, fleet renewal and fuel-flexible vessel designs.
Increased investor, regulator and customer scrutiny is addressed through transparent ESG disclosures, including CDP, S&P CSA, GRI and SASB and the publication of our Low Carbon Transition Plan annually.
Acute physical risks are mitigated with advanced weather routing, automated passage planning and risk-based vessel deployment strategies, while chronic risks are addressed through long-term climate-resilience planning and exploration of adaptive technologies.
Danaos has also identified and assessed climate-related opportunities and their potential financial impact. Resource-efficiency opportunities involve ongoing investment in energy-saving technologies, digital performance monitoring and operational optimization. As customer demand shifts toward low-carbon shipping solutions, our transparent emissions reporting and collaborative approach with clients position us advantageously. The transition to low-carbon fuels creates opportunities through the deployment of ECO vessels capable of future green-fuel retrofits. We continue to strengthen risk-management frameworks and integrate climate-scenario analysis into strategic planning.
All climate-related risks, opportunities, their potential financial impacts and associated response strategies are disclosed in detail in our CDP report, supporting transparency and alignment with global best practices.

We continue to strengthen risk-management frameworks and integrate climate-scenario analysis into strategic planning.
Emissions
Regulatory Framework in Shipping on Emissions Reduction
The regulatory landscape governing emissions reduction in shipping continues to accelerate, driven by international, regional and national efforts to decarbonize the sector. In 2025, the focus remained on short-term measures such as the Carbon Intensity Indicator (CII), alongside the industry’s increasing shift toward future fuels, including ammonia, hydrogen and sustainable biofuels, as well as innovative propulsion technologies. These developments support the broader pathway to achieving net-zero emissions by 2050.
The EU maintains a leading role through the extension of the EU Emissions Trading System (ETS) to maritime transport, effective from January 2024, following its adoption in 2023. Under this mechanism, shipping companies must purchase allowances for their CO₂ emissions, creating direct financial incentives for efficiency improvements and supporting the EU’s Fit for 55 target of a 55% emissions reduction by 2030. Complementary EU initiatives, including FuelEU Maritime and RED II, are accelerating the production and uptake of renewable and synthetic fuels, while the sustainability classification rules are guiding direct investment toward environmentally sustainable activities.
National and subnational authorities are also tightening requirements. Measures range from stricter emission caps and low-sulfur fuel mandates to enhanced enforcement in coastal waters. In the United States, the California Air Resources Board (CARB) enforces strict air quality standards for ships operating in California’s waters.
Despite regulatory progress, challenges persist. Fuel availability and the limited infrastructure for alternative fuels remain major barriers, requiring substantial investment and coordinated industry action. Technological maturity, operational impacts and cost burdens continue to shape the pace of transition. Danaos is proactively addressing these challenges by developing digital tools that monitor vessel emissions in real time, enabling early assessment of FuelEU compliance obligations and associated financial risks.
As the sector evolves through regulatory tightening, alternative fuel development and digital transformation, the need for continuous adaptation is evident. Danaos fully supports the IMO’s revised decarbonization ambitions and actively contributes to the development of practical pathways to meet them.
“Progress is never automatic; every step forward is a choice to build a better future.”
Danaos fully supports the IMO’s revised decarbonization ambitions and actively contributes to the development of practical pathways to meet them.
Heading towards decarbonization
Danaos approaches the pathway to emissions neutrality by 2050 with a balanced combination of ambition and operational realism. Our decarbonization strategy is anchored in two complementary pathways:
- maximizing the efficiency of the existing fleet and
- progressively transitioning toward vessels capable of operating on zero-carbon fuels.
These pathways are implemented through our Low Carbon Transition Plan (LCTP), which aligns the International Energy Agency’s (IEA) Beyond 2 Scenario (B2DS) decarbonization scenarios and supports commercially attractive growth with a reduced carbon footprint.
In line with this strategy, Danaos strengthened its climate targets by committing to a 50% reduction in carbon intensity by 2030 compared with 2008 levels, while maintaining the long-term objective of GHG Emissions neutrality by 2050.
We embarked on a comprehensive Low Carbon Transition Plan (LCTP) aimed at reducing emissions from our fleet by investing in ships that are commercially attractive with a low carbon footprint. Decarbonization journey towards 2050 hinges on two primary pathways:
- optimizing the current fleet of vessels and
- transitioning to a fleet of zero-carbon vessels powered by zero-carbon fuels.
In the near term, fleet optimization has remained a priority.
The short-term period (2025-2026) is aligned with the implementation of key regulatory changes, including the IMO’s Carbon Intensity Indicator (CII), the EU Emissions Trading System (EU ETS) and the FuelEU Maritime regulation. During this period, Danaos prioritized retrofitting the fleet, completing more than 300 energy-efficiency upgrades, including propulsion improvements, navigation enhancements and main engine tuning, all validated through speed and performance trials. In parallel, Danaos expanded its dry bulk portfolio, with efficiency upgrades and propulsion improvements already underway.
Biofuels are deployed as a short-term and near-term transition solution, supporting decarbonization while alternative fuels mature. Multiple bunkering campaigns using certified sustainable B24 and B30 blends have been carried out, primarily for vessels calling at EU ports, in line with regional regulatory requirements. The primary concern surrounding biofuels relates to the sustainability of the biomass feedstock used in their production. As demand for biofuels has already increased and is expected to continue growing, it is essential to apply robust due diligence in feedstock selection to mitigate potential adverse social and environmental impacts.
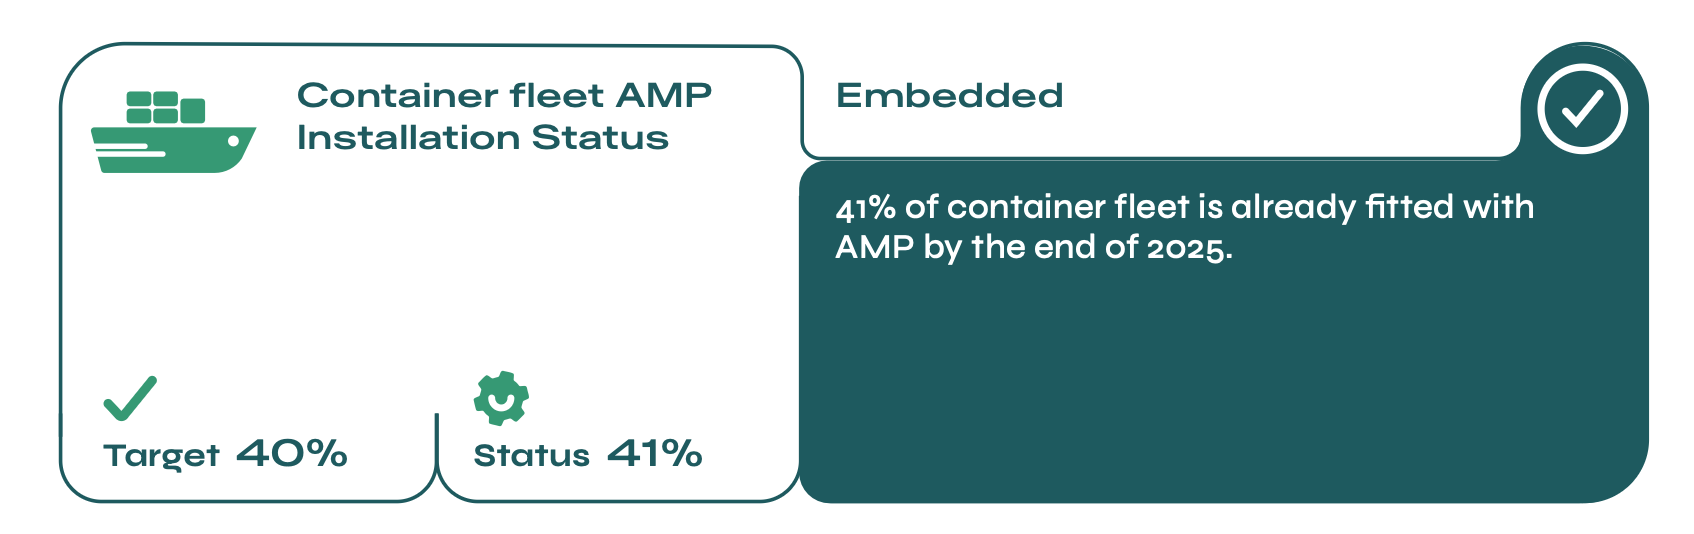
Medium-term initiatives focus on reducing emissions during port operations and preparing the fleet for fuel transitions. Danaos has already exceeded its commitment to equip 40% of the container fleet with Alternative Marine Power (AMP) by 2025, reducing emissions at berth and supporting compliance with evolving port regulations.
This period also covers the implementation of the IMO’s mid-term GHG reduction measures, including a transition phase to assess regulatory effectiveness. Danaos integrates the anticipated impacts of evolving regulations into its growth and investment planning. Green newbuilding vessels currently under construction are expected to join the fleet during this horizon. These vessels are designed to be “green fuel ready,” capable of operating on alternative fuels as they become commercially viable.
In addition, Danaos actively participates in industry initiatives, including membership in the Ammonia Energy Association and the Methanol Institute, to stay informed on developments regarding methanol and ammonia as maritime fuels.
The long-term horizon is critical for achieving deep decarbonization in line with global climate goals. To support fuel transition, Danaos prioritizes fleet renewal, divesting from older vessels while investing in new buildings with advanced environmental specifications, including ECO designs, methanol-ready capability and cold ironing systems. Eight (8) new buildings were successfully delivered in 2024-2025, while our orderbook as of first Quarter 2026 includes thirty-one (31) additional green vessels expected for delivery between 2026 and 2029. Danaos’ newbuilding program is anchored in advanced ECO vessel designs, with approximately 74.4% of newbuildings methanol-ready and 25.6% also ammonia-ready, ensuring flexibility for future sustainable fuel adoption.
Stakeholder engagement remains central to our decarbonization journey. Danaos collaborates closely with suppliers, charterers and financial institutions, embedding ESG criteria across the value chain. Active participation in initiatives such as the UN Global Compact and Global Maritime Forum’s Getting to Zero Coalition support alignment with emerging climate standards and scientific pathways.
Beyond operational emissions reductions, Danaos continues to address residual emissions through verified carbon offsetting of headquarters operations and employee commuting.
In 2024, the company further strengthened its climate strategy by enrolling thirty retrofitted vessels in a Gold Standard-compliant Voluntary Carbon Market program. In total, thirty (30) vessels retrofitted in 2024-2025 were enrolled enabling retrofit-related emissions savings to be monetized and reinvested into fleet renewal and environmental performance upgrades. There is a link between green performance and VCM, since funds anticipated for large scale retrofits will provide capital for ship-owing companies, making decisions for retrofits and green fuels more viable.
We have also performed speed trials to verify new speed power curves on both vessels retrofitted with propulsion improvements, as well as on vessels retrofitted with new propellers or ESDs.

Danaos’ newbuilding program is anchored in advanced ECO vessel designs, with approximately 74.4% of newbuildings methanol-ready and 25.6% also ammonia-ready, ensuring flexibility for future sustainable fuel adoption.

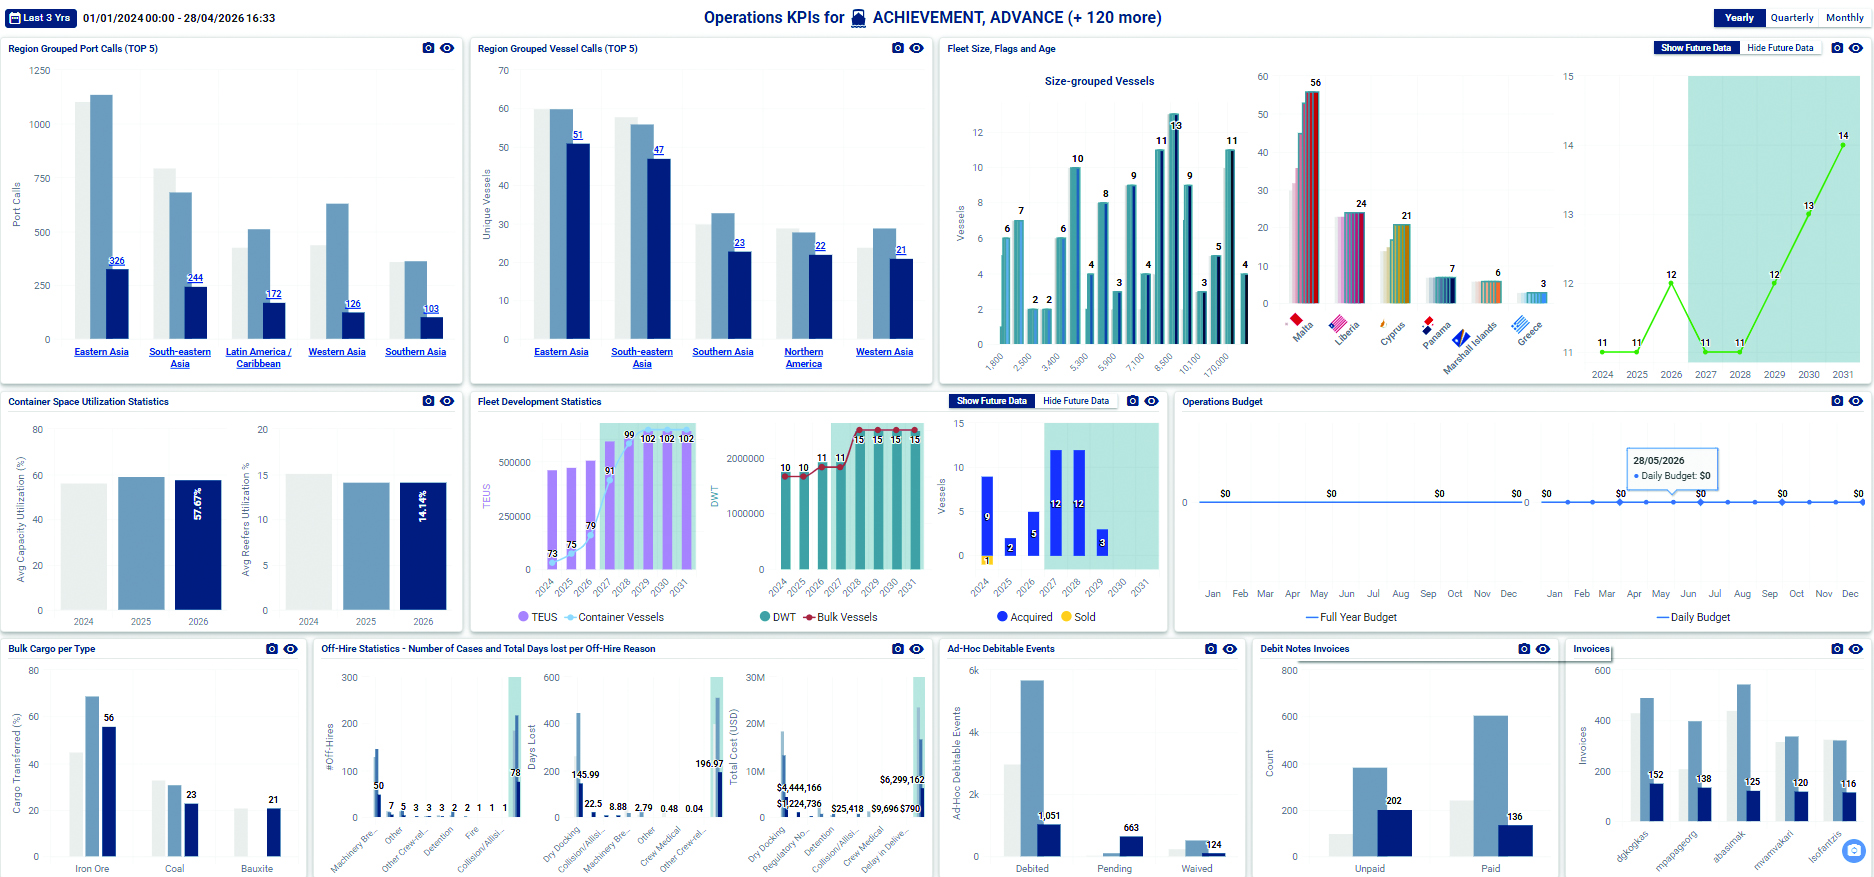
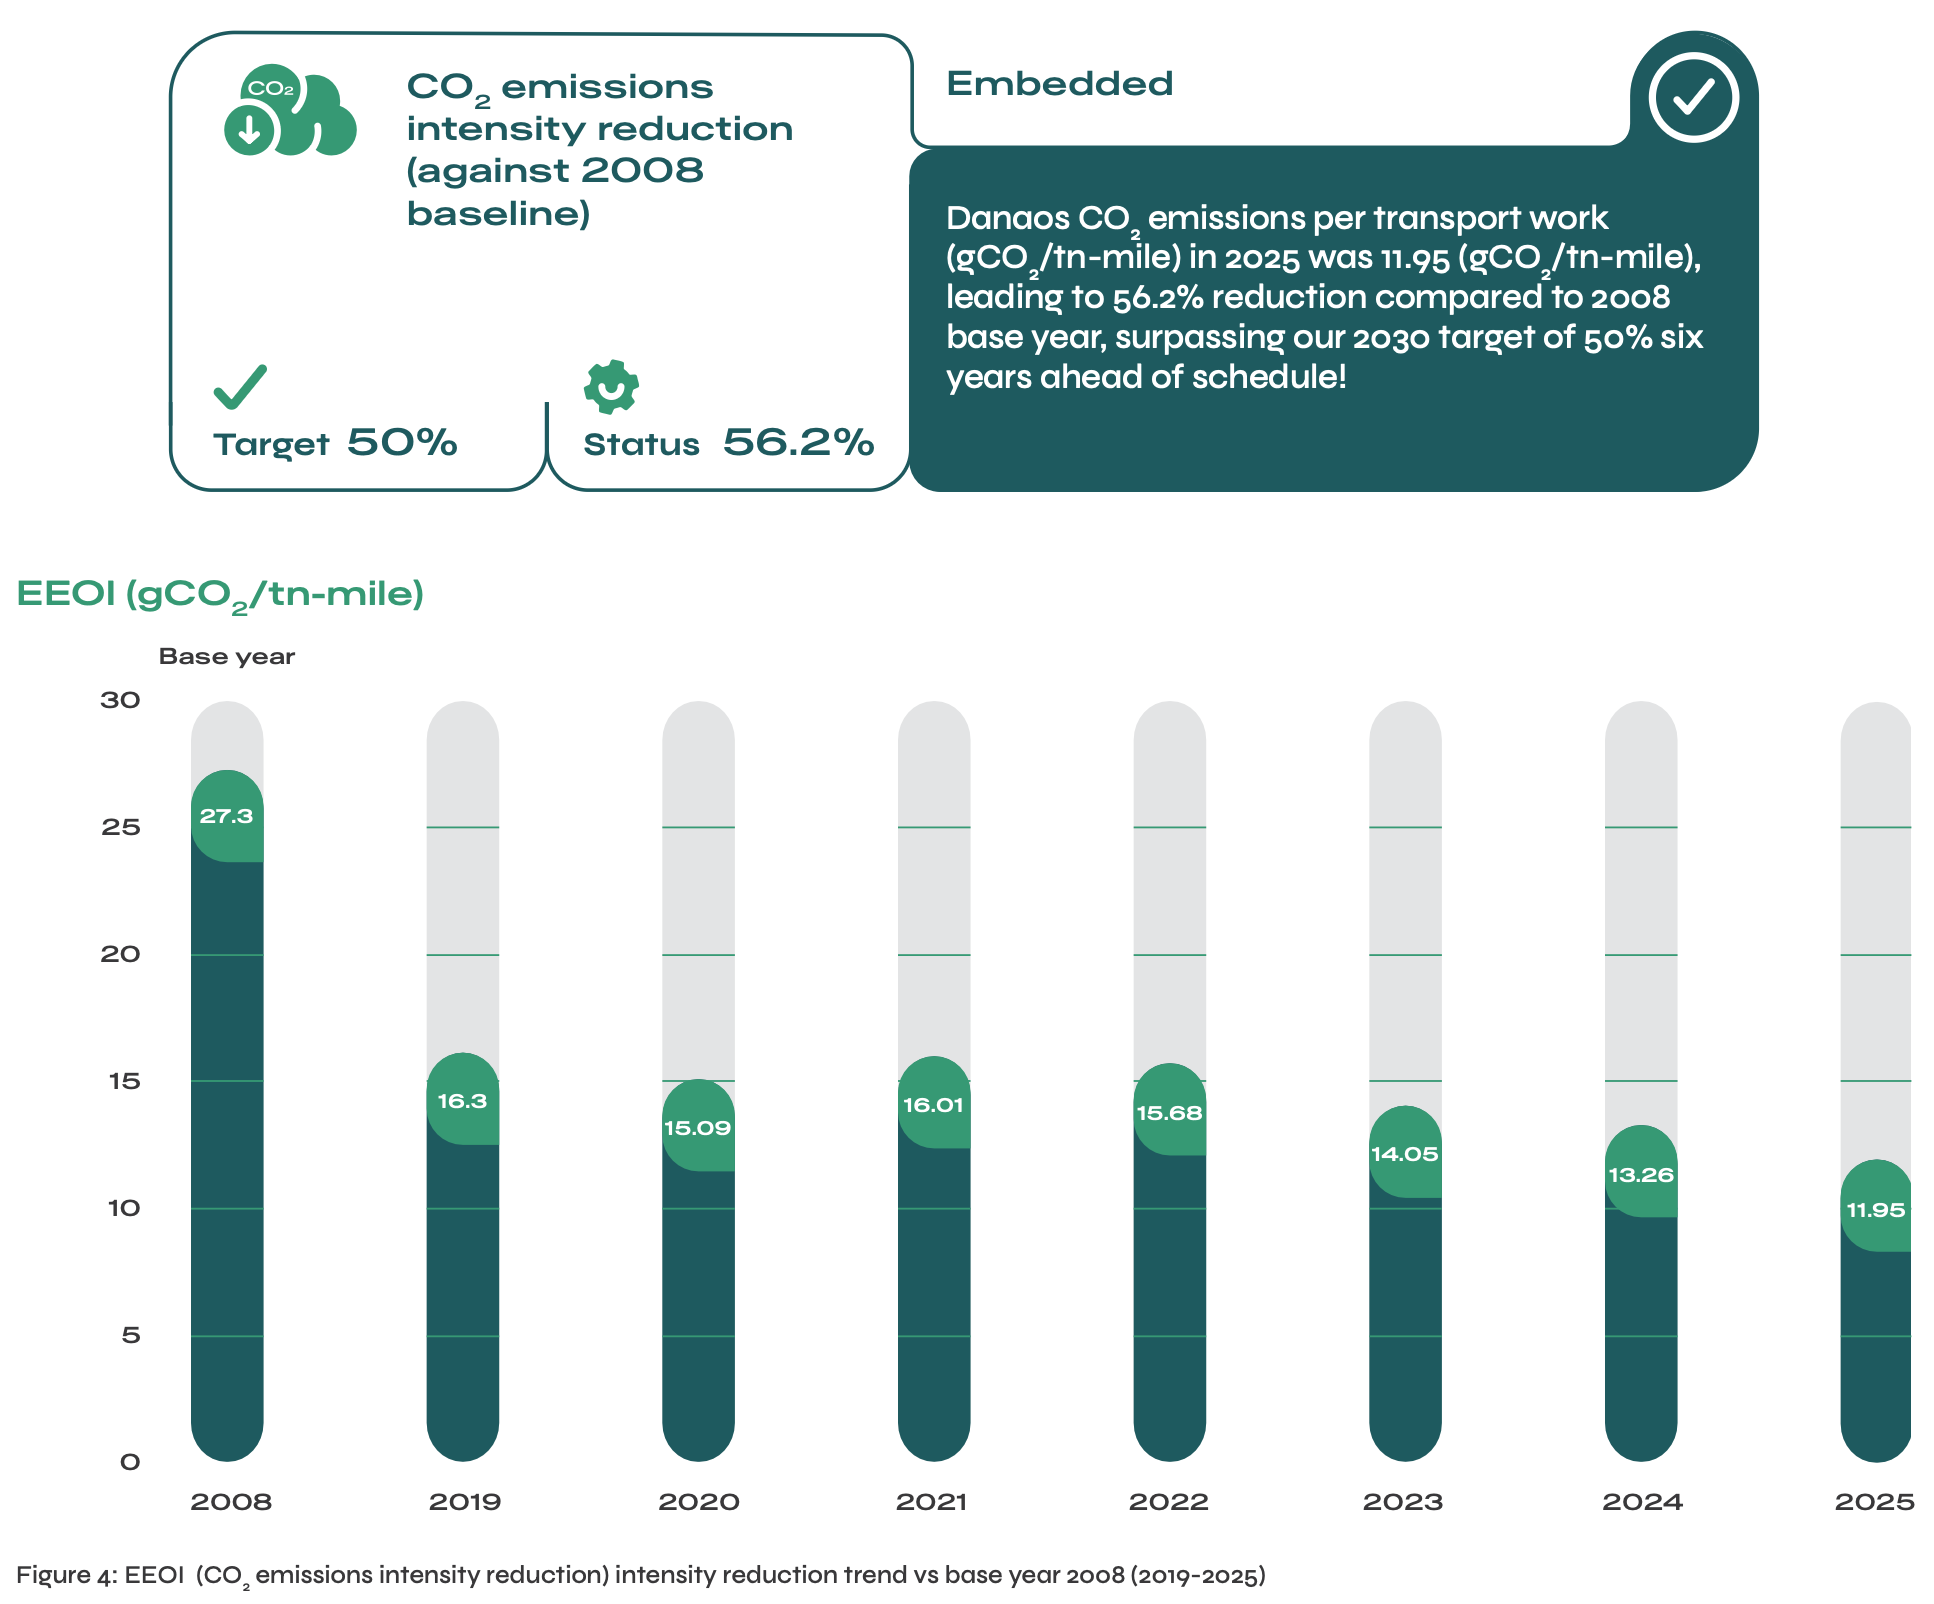
CO₂ emissions intensity reduced by 56.2% vs 2008 baseline, exceeding the 2030 reduction target (achieved in 2024) six years ahead of schedule.
Emissions Monitoring
Danaos has developed an advanced digital monitoring tool to measure and manage the fleet’s emissions and overall energy efficiency. Emissions are calculated across the entire fleet to ensure transparency, regulatory compliance and effective emissions management. These performance metrics serve as key indicators of environmental impact and, upon request, are shared with clients to support the assessment of their value-chain emissions in line with the Scope 3 GHG Protocol.
Our internally developed monitoring routine incorporates interactive Carbon Intensity Indicator (CII) calculations, vessel ratings and forward-looking projections of CO₂ emissions. This capability positions Danaos to respond effectively to existing regulatory mechanisms, including the EU ETS and FuelEU Maritime and to potential future market-based measures under the IMO’s evolving GHG framework.
Building on the significant speed reductions implemented in prior years, the fleet’s average operating speed decreased further to approximately 14.4 knots in 2025, compared with 14.7 knots in 2024. The average fleet draft remained broadly stable at 11.3 meters in 2025 (2024 at 11.2 meters), reflecting adjustments in trading patterns and cargo utilization, with no material impact on operational efficiency.
The cumulative impact of Danaos’ extensive retrofit program continued operational optimization and the delivery of newbuilding vessels during 2024–2025 was reflected in further improvements in energy efficiency. The fleet’s Energy Efficiency Operational Indicator (EEOI) declined to approximately 11.95 g CO₂ per tn-mile in 2025, compared with 13.26 g CO₂ per tn-mile in 2024, corresponding to a 56.2% reduction in CO₂ emissions intensity relative to the 2008 baseline.
With a 56.2% reduction in CO₂ emissions intensity in 2025 compared with the 2008 baseline, Danaos has exceeded its 2030 emissions intensity reduction target of 50%, six years ahead of schedule. The target was first achieved in 2024, and performance continues to outperform this level in 2025. This outcome demonstrates sustained progress toward the company’s long-term decarbonization objectives and reflects a combination of technical efficiency measures, operational discipline and strategic investment in lower-carbon assets, reinforcing Danaos’ commitment to supporting the maritime sector’s transition toward a lower-emissions future.
Danaos calculates its greenhouse gas (GHG) emissions and related KPIs using methodologies aligned with the BIMCO Ship Performance Indicators (Ship PI) platform (ship-pi.bimco.org), ensuring consistency with industry standards and alignment with tools commonly used by our charterers. In addition, emissions are quantified in accordance with the Greenhouse Gas (GHG) Protocol Corporate Standard and applicable IMO and EU regulatory frameworks, supporting transparency, methodological rigor and comparability in emissions reporting and performance assessment. As of 2025, reporting also includes methane (CH₄) and nitrous oxide (N₂O), enabling the calculation of total CO₂-equivalent (tCO₂e) emissions and alignment with evolving regulatory and disclosure requirements.
CO₂ and other emissions for 2024-2025
| Emissions | 2024 | Change 2023-2024 | 2025 | Change 2024-2025 |
|---|---|---|---|---|
| CO₂ (tCO₂) | 3,799,558 | +21.8% | 3,744,982 | -1.4% |
| CO₂ Emissions Intensity (gCO₂/tn-mile) | 13.26 | -5.6% | 11.95 | -9.9% |
| SOx (tn SOx) | 10,530 | 20% | 10,399 | -1.2% |
| SOx Eff (gSOx/tn-mile) | 0.04 | 0 | 0.03 | -25% |
| NOx (tNOx) | 114,753 | 19.7% | 112,469 | -2% |
| NOx Eff (gNOx/tn-mile) | 0.4 | -7% | 0.36 | -10% |
| CH₄ and N₂O (tCO₂e) | 59,907 | +19% | 58,995 | -1.5% |
Table 2: CO₂ and other emissions for 2024-2025.
Following the successful implementation of the IMO 0.5% global sulfur cap in 2020, Danaos has continued to strengthen the monitoring of sulfur oxides (SOx) and nitrogen oxides (NOx) across the fleet. As of 2025, nine existing vessels are equipped with open-loop scrubbers, while six newbuilding vessels delivered in 2024 and two bulk carriers are also fitted with SOx scrubbers.
Fleet operations within SOx and NOx Emission Control Areas (ECAs) are closely monitored, and regions restricting the use of open-loop scrubbers are continuously tracked and reflected in our operational monitoring maps. Danaos has implemented integrated monitoring of both air emissions and scrubber washwater discharge, enabling early detection of potential malfunctions and minimizing the risk of non-compliance. Scrubber performance is continuously supervised through the WAVES data analytics platform, supported by reference logs and automated alerts, ensuring ongoing compliance with applicable environmental regulations. In parallel, thirty (30) newbuild vessels will be equipped with SOx scrubbers and NOx Tier III emission-reduction technologies, including Selective Catalytic Reduction (SCR) and Exhaust Gas Recirculation (EGR) systems. Our R&D function continues to assess emerging emissions-control technologies to identify solutions that balance environmental performance, operational reliability and regulatory readiness.
The efficiency gains reflected in Danaos’ emissions performance are the result of a combination of operational optimization and targeted retrofits. It is estimated that, for these Low Carbon Products (based on provided data of fuel savings from makers), which are being monitored for their reliability via Waves, that the deployment of low-carbon technologies and retrofit solutions has reduced fuel consumption by approximately 5% compared to baseline operation without these interventions.
Danaos has also continued to expand the installation of Alternative Marine Power (AMP) systems to reduce emissions while vessels are at berth. By 2025, the company achieved its AMP installation target, with fourteen additional vessels equipped, including newbuilding vessels delivered in 2024-2025. As a result, 41% of the container fleet and approximately 36% of the total fleet, including bulk carriers, are AMP-equipped. Through its AMP program, Danaos is proactively positioning its fleet to meet these requirements and to support the broader decarbonization of port operations.

Through its AMP program, Danaos is proactively positioning its fleet to meet these requirements and to support the broader decarbonization of port operations.
Danaos’ long-term objective is to increase AMP coverage to 81% of the container fleet by 2030, supporting port-side decarbonization and compliance with increasingly stringent shore-power requirements. These investments are aligned with evolving European regulatory developments that mandate that major EU ports must provide Onshore Power Supply (OPS) infrastructure by 1 January 2030 for container and passenger ships, with the requirement extending to additional ports by 2035. Under the Alternative Fuels Infrastructure Regulation (AFIR) and the FuelEU Maritime Regulation, docked vessels above 5,000 gross tonnage calling at designated EU ports will be required to connect to OPS or use alternative zero-emission technologies, with the objective of eliminating auxiliary engine emissions while at berth.
Fleet EEOI - CII Data
| Fleet EEOI – CII Data | 2024 | 2025 |
|---|---|---|
| AER | 6.72 | 5.96 |
| EEOI | 13.26 | 11.95 |
| EEXI Compliance | 100% | 100% |
| CII Compliance | 60% (A-B-C CII RATED) | 79.5% (A-B-C CII RATED) |
| CII-A Vessels | 19% | 15.7% |
| CII-B Vessels | 20% | 30.1% |
| CII-C Vessels | 21% | 33.7% |
| CII-D Vessels | 29% | 16.9% |
| CII-E Vessels | 11% | 3.6% |
| Fuel Consumption | 1,220,112 | 1,201,525 |
Table 3: AER, EEXI, CII, EEOI, FUEL CONSUMPTION for Danaos Fleet for 2024-2025 (in tons).
Scope 1 (Direct) – Scope 2 (Indirect) – Scope 3 GHG Emissions
Danaos calculates and reports its direct greenhouse gas emissions (Scope 1) and indirect emissions from purchased electricity (Scope 2), with emissions allocated on a client basis where applicable. In parallel, the Company continues to enhance the collection, coverage and quality of value-chain greenhouse gas data (Scope 3) associated with its business activities.
Scope 1 emissions primarily arise from fuel combustion during vessel operations, the majority of which occur in international waters. Emissions are calculated based on actual fuel consumption data and recognized emission factors, in accordance with the GHG Protocol Corporate Standard and applicable maritime regulatory requirements. As of 2025, Scope 1 greenhouse gas reporting has been expanded to include methane (CH₄) and nitrous oxide (N₂O), enabling the calculation of total carbon dioxide equivalent emissions (tCO₂e) and supporting alignment with evolving regulatory, IMO and EU disclosure requirements. Prior-year figures have been restated accordingly to ensure comparability across reporting periods.
Scope 2 emissions are calculated and reported using both the market-based and location-based approaches, in line with the GHG Protocol requirements. The market-based method applies regional residual mix emission factors, while the location-based method are calculated using national grid emission factors. For EU countries, emission factors are sourced from the European Environment Agency and for non-EU countries, emission factors are sourced from the International Energy Agency, ensuring methodological transparency, consistency, and comparability. As of 2025, the organizational boundary for Scope 2 reporting has been expanded to include electricity consumption from the Tanzania office in Zanzibar. In previous reporting periods, emissions from this location were not calculated due to the unavailability of supplier-specific data, contractual instruments, and reliable country-specific emission factors. Accordingly, Scope 2 emissions are now reported for all six operational locations under our operational control, comprising five offices and one site office (project-based facility). A site office embedded within a third-party shipyard in China has been excluded from the Scope 2 boundary, as operational control rests with the shipyard operator.
In 2025, Danaos achieved a 3% reduction in Scope 2 emissions compared with the previous year, primarily reflecting continued implementation of energy-efficiency measures and optimized electricity consumption across shore-based facilities.
A structured procedure for Scope 3 emissions reporting has been established and continues to evolve. This includes the collection of emissions data from suppliers and partners, with reported Scope 1 and Scope 2 emissions allocated to Danaos where relevant. Key Scope 3 emissions categories include emissions associated with business travel and Well-to-Tank (WtT) fuel lifecycle emissions. WtT emissions are calculated in accordance with the FuelEU Maritime Regulation (EU) 2023/1805, which mandates the use of a Well-to-Wake lifecycle methodology for greenhouse gas intensity calculations.
Moreover, Scope 3 categories have been expanded as the company has collected accurate emissions data from courier service companies, to estimate emissions of sending goods onboard through procurement activities, while since 2023 we report shipyard shore power during drydockings and supplier Scope 3 emissions collection through ESG questionnaire embedded in the Danaos Analytics Platform, supporting supplier engagement, transparency and continuous improvement across the procurement process.
More specifically, our R&D department, in cooperation with our Procurement department, has implemented an emissions recording and ESG data collection module within the Beyond WAVES platform, through which suppliers report Scope 1 and Scope 2 emissions related to Danaos activities alongside broader ESG indicators. Allocations are calculated in accordance with the GHG Protocol Corporate Value Chain (Scope 3) Standard. The system supports supplier engagement, transparency and continuous improvement across the procurement process and enables monitoring of ESG partner performance through defined KPIs. The company has set prerequisite and mandatory criteria, mainly related to people and secondary ones related to GHG emissions. Our aim is to assess and measure sustainability activity and ensure the sustainable and efficient performance of our supply chain in compliance with our requirements and standards, which is necessary for creating positive value.
Our “Emissions Allocation” function devised in our WAVES platform allocates our Scope 1 emissions on a client/vessel basis, so that our clients can in turn evaluate the size of their contribution in a holistic approach, as a part of the value-chain environmental footprint and thus refine their strategy accordingly.
During 2025, Danaos enhanced its greenhouse gas (GHG) accounting methodology to further align with evolving regulatory and reporting requirements. Key updates include:
- Scope 1 reporting includes methane (CH₄) and nitrous oxide (N₂O), enabling full reporting in carbon dioxide equivalent (tCO₂e);
- Adoption of FuelEU Maritime Regulation (EU) 2023/1805 emission factors for Well-to-Tank (WtT) emissions calculations;
- Restatement of 2024 comparative figures to ensure methodological consistency and year-on-year comparability.
These updates represent methodological enhancements only and do not reflect changes in operational performance or fuel consumption. As of 2025, the Scope 2 reporting boundary was expanded to include the Zanzibar office in Tanzania, with emissions calculated under both location-based and market-based methodologies using the IEA country emission factor in the absence of supplier-specific data.
Below are presented Danaos Greenhouse Gas Emissions Scope 1, Scope 2 and Scope 3 emissions for the year 2024-2025.
Total GHG Emissions
| Total GHG Emissions5 | 2024 | 2025 |
|---|---|---|
| Total direct (Scope 1) emissions (tCO₂e)6,7,8 | 3,819,113 | 3,793,839 |
| Total energy indirect (Scope 2) emissions (tCO₂e)9 | 305 | 290.8 |
| Total other indirect (Scope 3) emissions (tCO₂e)10 | 677,000 | 670,098 |
Table 4: Total GHG Emissions (2024-2025)
Biogenic emissions (disclosed separately)
| Biogenic emissions | 2024 | 2025 |
|---|---|---|
| Biogenic CO₂ emissions – Biofuel (tCO₂e) | 40,353 | 10,138 |
Table 5: Biogenic emissions (2024-2025)
Scope 1 emissions
| Scope 1 (tCO₂e) | 2024 | 2025 |
|---|---|---|
| Containers | 3,585,542 | 3,521,935 |
| Bulkers | 233,571 | 271,904 |
| Total | 3,819,113 | 3,793,839 |
Table 6: Scope 1 emissions for Container and Bulker fleet for 2024-2025.
Scope 2 (Market-based)
| Office | 2024 MWh | 2024 tCO₂e | 2024 Renewable | 2025 MWh | 2025 tCO₂e | 2025 Renewable11 |
|---|---|---|---|---|---|---|
| Greece | 1,011.2 | 291.4 | 48.5%* | 1,084.5 | 260.5 | 49.95%* |
| Cyprus | 12 | 6.4 | — | 10.7 | 5.7 | — |
| Russia | 9.2 | 0.39 | — | 10 | 0.42 | — |
| Ukraine | 14.3 | 4.16 | — | 12.6 | 4.35 | — |
| Korea | 5.7 | 2.68 | — | 4.5 | 2.16 | — |
| Tanzania | — | — | — | 62.8 | 17.7 | — |
| Total | 1,052.4 | 305 | 47% | 1,185.1 | 290.8 | 46% |
Table 7: Scope 2 Market-based emissions for 2024-2025.
⁵ Organizational and operational boundaries are applied consistently across Scope 1, Scope 2 and Scope 3 emissions unless otherwise stated.
⁶ Scope 1 emissions include CO₂, CH₄ and N₂O using Global Warming Potential (GWP) values based on IPCC AR5 (100-year time horizon).
⁷ Scope 1 emissions do not include biofuel combustion. Biogenic emissions relate to biofuel combustion and are reported separately from fossil GHG emissions (Table 5) in accordance with GHG Protocol guidance.
⁸ Comparative 2024 Scope 1 figures have been recalculated to include CH₄ and N₂O emissions and are expressed in tCO₂e.
⁹ Scope 2 emissions are based on Market-based method, reflecting the emissions reduction achieved through the procurement of renewable electricity, while Scope 2 emissions calculated using the Location-based method are presented in Table 8.
¹⁰ Scope 3 emissions include categories as listed in Table 9. During 2025, Danaos updated its WtT emissions calculation methodology to align fully with the FuelEU Maritime Regulation. Accordingly, 2024 comparative figures have been restated using the same FuelEU emission factors to ensure consistency and comparability of reported emissions across reporting periods. The restatement resulted in an increase in previously reported 2024 WtT emissions due solely to the application of revised regulatory emission factors.
¹¹ Reference DAPEEP report for Aggregated Energy Mix results. Data for 2024 is used, as data for 2025 will be published in July 2026.
Scope 2 (Location-based) 12
| Office | 2024 MWh | 2024 tCO₂e | 2025 MWh | 2025 tCO₂e |
|---|---|---|---|---|
| Greece | 1,011.2 | 284.2 | 1,084.5 | 309.1 |
| Cyprus | 12 | 6.8 | 10.7 | 5.7 |
| Russia | 9.2 | 3.2 | 10 | 3.9 |
| Ukraine | 14.3 | 4.0 | 12.6 | 3.3 |
| Korea | 5.7 | 2.4 | 4.5 | 2.0 |
| Tanzania | — | — | 62.8 | 17.7 |
| Total | 1,052.4 | 300.6 | 1,185.1 | 341.7 |
Table 8: Scope 2 Location-based emissions for 2024-2025.
¹² Reference national grid average emission factors applied to electricity consumption at each site, using for EU countries the EEA and for non-EU countries the IEA most recent available data (2025 edition).
For Danaos’ Russia office, the difference between Scope 2 market-based and location-based emissions reflects the emission factors applied. The market-based method uses a regional residual mix factor provided by our provider, reflecting the lower-carbon St. Petersburg grid mix (primarily nuclear and hydropower), while the location-based method applies the national grid emission factors (sourced from the IEA).
Scope 3 emissions
| Scope 3 (tCO₂e) | 2024 | 2025 |
|---|---|---|
| Fuels + MGO WtT | 647,511 | 662,274 |
| Upstream Transportation and Distribution (Courier) | 1,082 | 849 |
| Business travel | 6,007 | 6,637 |
| Employees commuting | 198 | 208 |
| Purchased Good and Services (Suppliers) | 252.3 | 27.7 |
| Purchased Good and Services (Yards shore power) | 288.7 | 102.1 |
| Total | 677,000 | 670,098 |
Table 9: Scope 3 emissions (2024-2025).
Ozone Depleting Substances
We have incorporated the modifications from the old systems to the new ones and, according to the regulations, any deliberate emission of ODS is prohibited. For new building vessels, any installation containing ODS, such as halons and chlorofluorocarbons (CFCs), is prohibited. The Freon Types in use are R-404A, R-410, R-417 and R-407C. Total Freon Capacity increased in 2025 due to the increase in the number of vessels from 81 in 2024 to 83 within 2025. Freon losses for 2025 were at 11.1% of the total capacity, reflecting that our efforts to reduce losses are paying off.
We plan to reduce greenhouse gas emissions and mitigate climate change, based on EU F-gas Regulation (517/2014) adopted 1 Jan 2015 for reduction of use of HFCs. A service ban on HFCs with high Global Warming Potential (GWP >2,500) like R-404A, R-507 and R-422A has been imposed since 1 Jan 2020. The F-gas regulation applies to all EU countries and EU flagged vessels. Therefore, replenishment of retrofit systems with lower GWP refrigerants takes place where required.
| GWP (Global Warming Potential) | 2024 | 2025 |
|---|---|---|
| Total Freon Capacity (tons) | 29.9 | 31.1 |
| Total Freon Losses (%) | 10.5% | 11.11% |
Table 10: Freon Capacity and Losses Overview for 2024-2025.
Energy
Energy – Fuel Consumption
Danaos’ R&D Department plays a central role in improving energy efficiency across the fleet by extensively investigating options for minimizing transportation costs and the subsequent fuel consumption required per cargo transferred. This includes optimizing the vessels’ design and operating profile and consequently monitoring performance. More than that, the R&D department continuously evaluates alternative fuel pathways, including methanol, ammonia, LNG and hydrogen, to support the long-term energy transition.
Fleet energy consumption is reported annually and includes fossil fuels consumed onboard Danaos-operated vessels and shore-based infrastructure. Total energy consumption decreased by ~0.5% in 2025 compared to 2024. Danaos does not have material energy consumption outside the organization attributable to its operations.
| Energy Consumption (TJ) | 2024 | 2025 |
|---|---|---|
| Consumption of Fuel | 46,876 | 46,030 |
| Consumption of Diesel | 1,434 | 2,610 |
| Renewable Energy (Fuel and Electricity) | 646 | 149 |
| Consumption of purchased non-renewable electricity | 2.0 | 2.3 |
| Total energy consumption | 48,959 | 48,791 |
Table 11: Energy Consumption for 2024-2025.
Renewable electricity share reflects supplier-specific energy mix data available only for headquarters (49.95% renewable); other offices are conservatively treated as non-renewable due to lack of supplier information, resulting in a 46% renewable share in 2025.
Danaos has been certified under the ISO 50001 Energy Management System since 2015. Energy efficiency KPIs are systematically monitored to support regulatory compliance, improve vessel performance and enhance Carbon Intensity Indicator (CII) ratings.
On top of the above and as a part of our effort to achieve optimum CII results for our fleet, numerous retrofits have taken place within 2025 as depicted below:
| Renewable electricity share across all Offices | 2024 | 2025 |
|---|---|---|
| % renewables | 47% | 46% |
Table 12: Percentage of renewable energy for Danaos Offices in 2024 and 2025.
As part of its decarbonization strategy, Danaos implemented an extensive retrofit program during previous years.
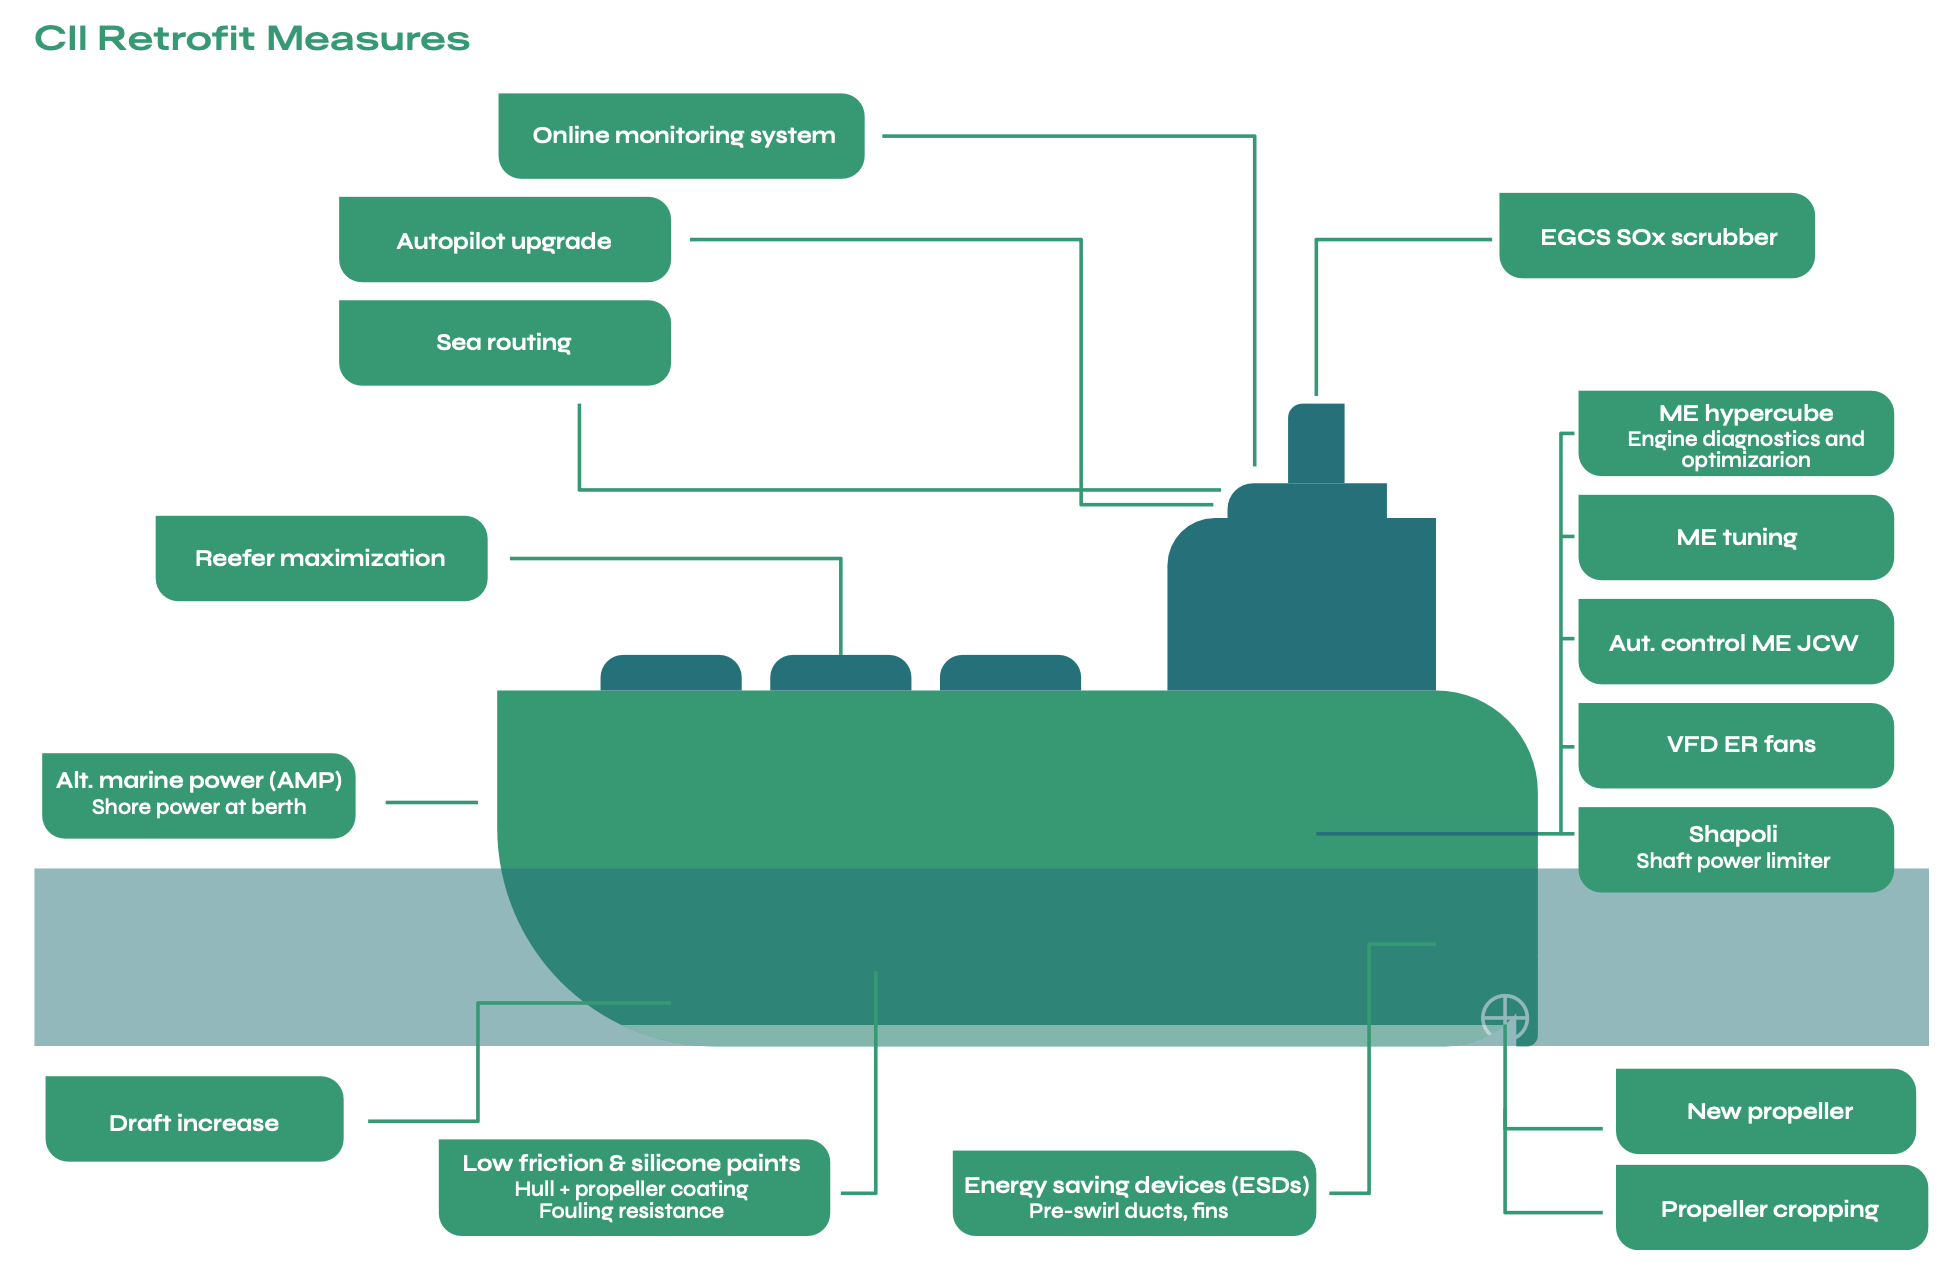
Energy Efficiency measures and initiatives to improve CII
As part of its decarbonization strategy, Danaos implemented an extensive retrofit program during previous years. This included the completion of 3 propeller retrofits in our container fleet, all fitted with propeller BTF as well as 4 Energy saving device (ESD) installation. All above investments are of course distributed in different implementation periods throughout 2025 and various retrofits were carried out on different vessels with various operational profiles. From the investment in the aforementioned low carbon products and enhancements, we have concluded to a fleet weighted average of 5% savings in fuel consumption per vessel.
Danaos also continued its diversification into the dry bulk sector, with the acquisition of three additional Capesize carriers delivered within 2024, increasing the number of bulk carriers to ten (10) in total. Technical optimizations and retrofits are being implemented for the second-hand Capesize Bulk Carriers acquired, in order to be further optimized, aiming to performance improvement and emission reduction. In 2025, we completed 1 ESD installation (PSV, HVAF and propeller trimming) on a bulk carrier and 1 more vessel remains to be completed with 2026, while one vessel was delivered with the ESD installed. Compliance with Rightship standards and aiming to achieve good fleet rating scores refers to energy optimizations as well, apart from safety aspects.
Low-friction hull coatings remain a key efficiency lever, with seventeen (17) vessels coated under the Company’s Low Friction Paint Campaign. These measures are complemented by optimized vessel loading, steering practices and voyage planning, delivering further power and emissions savings.
Retrofits carried out in 2025
| Scope | Complete 2025 | Total |
|---|---|---|
| Sea Routing | 26 | 47 |
| New Propeller | 3 | 25 |
| Propeller Cropping | 1 | 9 |
| Energy Saving Devices (ESDs) | 4 | 44 |
| VFD ER Fans | – | 7 |
| Aut. Control ME JCW | – | 6 |
| ME Tuning | – | 10 |
| ME Hypercube | – | 1 |
| Draft Increase | – | 37 |
| Online Monitoring System | 3 | 82 |
| Autopilot Upgrade | – | 63 |
| Alternative Marine Power (AMP) | 8 | 30 |
| Shapoli | – | 51 |
| Low Friction Paints | 17 | 66 |
| Silicone Paints | – | 1 |
| Propeller Silicone Painting | – | 2 |
| EGCS SOx Scrubber | – | 17 |
| Reefer maximization | – | 23 |
Table 13: Retrofits carried out in 2025.
Fuel Consumption
| Fuel Consumption | 2024 | 2025 |
|---|---|---|
| HFO-LFO (MT) | 1,168,860 | 1,136,438 |
| Biofuel (MT) | 15,742 | 3,972 |
| MGO (MT) | 35,630 | 61,115 |
| Power efficiency index (%) | 35.2% | 35.0% |
| Reefer utilization (%) | 16.6 | 16.4 |
| Average reefer load (kW) | 4 | 4 |
Table 14: Fuel Consumption for 2024-2025.
Newbuilding Program
As of end of 2025, twenty-five (25) container newbuilding vessels are under construction and are scheduled for delivery between 2026 and 2029. Danaos’ newbuilding strategy prioritizes ECO designs that support green fuel flexibility and long-term decarbonization. The 82% of these new buildings are methanol-ready and 30% also ammonia-ready, including the newbuilding vessels already delivered. Eight newbuilding vessels were delivered in 2024–2025, featuring advanced ECO designs and capable of accommodating green fuels. These vessels are equipped with NOx Tier III emission-reduction technologies, supporting compliance with stringent environmental standards.
Danaos’ newbuilding strategy prioritizes ECO designs that support green fuel flexibility and long-term decarbonization.
Waste Management
Danaos’ activities produce a range of waste streams, including used spare parts from vessel maintenance, sludge generated through fuel consumption, onboard waste from routine shipping operations, and waste originating from shore-based facilities. Our waste management emphasizes continuous innovation and operational efficiency to reduce waste generation across fleet and shore-based operations. Initiatives include strengthening waste segregation processes, advancing documentation digitalization to lower environmental impacts, and systematically assessing opportunities for recyclable and reusable materials onboard and ashore in support of circular economy practices.
Waste reduction and proper waste handling training is provided to employees and crew as part of onboarding and refresher programs, with a focus on pollution prevention, regulatory compliance and responsible disposal practices.
Circular Economy and Responsible Waste Management
A key initiative supporting circularity is the ReNAV campaign, led by the Electrical Department, which focuses on the upcycling and reuse of navigation and communication equipment. Given the high level of fleet standardization across sister vessels, equipment and spare parts removed during retrofits are assessed for reusability. Components unaffected by the fault triggering the retrofit are either redeployed onboard other vessels or retained as office stock for future use, extending asset life cycles and reducing waste generation. Typical equipment included in the ReNAV scheme comprises marine monitors, processor cards and satellite communication systems.
Equipment that cannot be reused is dismantled into basic components, such as batteries, bare metal parts like frames etc., electronic components, and delivered to licensed recycling facilities.
Through the ReNAV campaign within 2025, a total of 34 systems have been recycled, 29 systems have been upcycled (have been retrofitted and kept in office stock or sent to other vessels for reuse) and 3 systems have been repaired.

A key initiative supporting circularity is the ReNAV campaign, which focuses on the upcycling and reuse of navigation and communication equipment.
Ship Recycling – Handling of Hazardous Materials
We pay special attention to the proper recording of hazardous materials, ensuring smooth cooperation with our suppliers, safe recycling of vessels at the end of their life and selecting recycling facilities which embody safe practices.
Since 2017 Danaos has been training its own Quality Control Engineers, as “Hazmat Experts” (currently approved by two Classification Societies: KR & DNV). Danaos’ Quality Control Engineers have proceeded with sampling and preparation of Inventories of Hazardous Materials (IHM) to the entire Fleet, acting proactively so as necessary certification both for EU and HKC to be available.
Within 2025, the entire Fleet was in full compliance with current Regulations related to IHM Certification and IHM Maintenance.
Presently IHM Maintenance is followed as an ongoing process, keeping vessels’ records up to date, while at the same time constant monitoring of new Resolutions or amendments on Guidelines is considered integral part of IHM.
Waste Onboard Management
Garbage segregation is implemented onboard all vessels in accordance with the Danaos Safety Management System (DSMS), pollution prevention procedures and MARPOL requirements. The company promotes waste prevention, reduction, reuse and recycling and minimizing waste streams, including garbage generated on board. We provide separate waste streams at the point of collection, so that garbage can be separated and discharged ashore more effectively.
Ship-generated waste is delivered to licensed port reception facilities and managed in accordance with applicable local and international regulations. Danaos’ policy requires waste segregation both onboard and ashore to support recycling wherever feasible. Onboard waste streams are categorized into liquid and solid waste, each managed under strict control procedures according to MARPOL (International Convention for the Prevention of Pollution from Ships).
Solid operational waste primarily arises from maintenance activities. Recyclable materials, such as metallic parts, are discharged ashore for recycling, while others non-recyclable items, such as oily rags are incinerated onboard to reduce the volume of waste ending up at the landfills.
In compliance with the regulations, ash is collected, retained onboard and discharged at port reception facilities, to be further used as raw material in the construction industry. Since 2023, the total amount of ash disposed ashore was recorded as part of our systematic reporting and is shown below.
Other waste generated from the living spaces is segregated in categories and disposed ashore for recycling. Waste that is categorized as Hazardous and Medical is carefully segregated, clearly labelled and disposed ashore according to international and national regulations. Two sub-categories of operational waste, which are totally separated as Hazardous, consist of jerrycans & paint cans, for which special care is provided to minimize to the extent possible the remnants of paint/chemical contained. In 2025, we continued recording the quantities of these two items separately from other operational waste, to ensure safe disposal.
Improvements recorded on waste recycling between 2024 and 2025 are available in the table below:
| Waste Stream | 2024 | Difference (2023-2024) | 2025 | Difference 2024-2025 |
|---|---|---|---|---|
| Plastics (m³) | 2,557 | 9% | 2,779 | 9% |
| Cooking oil (m³) | 16.87 | 13% | 22.67 | 34% |
| e-Wastes (m³) | 115 | 17% | 132 | 15% |
| Ashes (m³) | 66.4 | 174% | 29.1 | -56% |
Table 15: Waste for 2024-2025.
Between 2023–2024 and 2024–2025, changes in onboard waste recycling reflect both operational and technical improvements. Used cooking oil (UCO) generated onboard increased in 2025, reflecting higher fleet utilisation, the addition of vessels with larger galley facilities and enhanced onboard tracking practices. Increased galley activity also reflects the company’s ongoing investment in crew welfare and the provision of healthier nutrition standards onboard, in line with the Maritime Labour Convention. All UCO generated across the fleet is 100% collected and transferred to licensed facilities for biodiesel production, consistent with the company’s circular economy commitments. In contrast, the ash generation decrease is attributed to the increased use of garbage compactors, which minimize the volume of waste requiring incineration as well as operational constraints, such as round-trip voyage patterns where waste cannot always be discharged ashore for recycling, continue to necessitate onboard incineration.
To minimize ship-generated garbage, Danaos works closely with approved ship chandlers to reduce packaging, promote bulk supplies, encourage reusable or recyclable packaging and return packaging materials to suppliers wherever possible. More specifically, we have agreed with our approved ship-chandlers on a number of practices such as:
- Using supplies that come in bulk packaging, considering factors such as adequate self-life (once a container is open).
- Using supplies that come in reusable or recyclable packaging and containers.
- Avoiding supplies that are packaged in plastic, unless reusable or recyclable plastic is used.
- Wrapping which protects goods on their way to the ship should be replaced in the port before receiving the goods.
- Crew should return plastic, paper and wooden packing materials to the respective suppliers.
Total onboard waste volume per DWT increased modestly in 2025, primarily driven by the bulker fleet, reflecting recent vessel acquisitions. Newly delivered bulk carriers underwent drydocking upon delivery, which affected waste reporting consistency and may have influenced bulker waste intensity figures. The container fleet remained stable, supported by the integration of two newbuilding vessels.
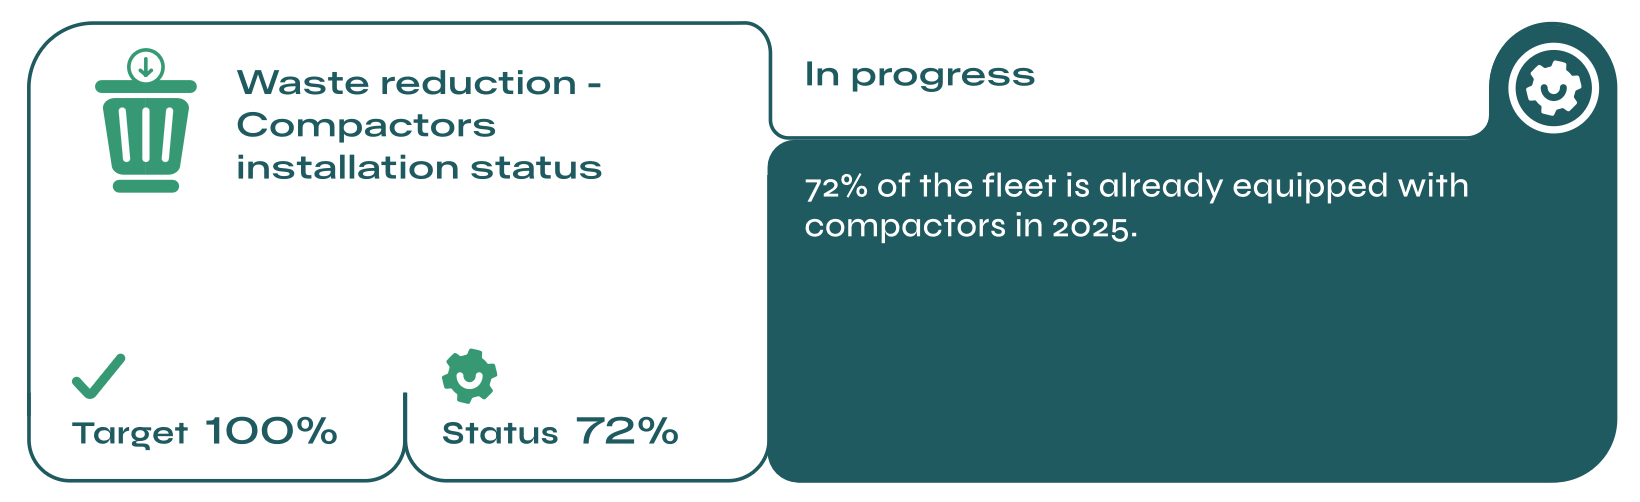
As part of the Company’s 3R (Reduce, Reuse, Recycle) program, garbage compactors are progressively being installed across the fleet to support the target of reducing onboard waste volume by 50% relative to the 2021 baseline. By the end of 2025, 60 vessels (72% of the fleet) had been equipped with compactors, with installation across the entire fleet targeted to be completed by the end of 2026. Compactors process key waste streams including plastics, aluminium, paper, and jerrycans, reducing onboard waste volume by more than 50%. Waste intensity is systematically monitored to track progress and assess program effectiveness while accounting for changes in fleet size over time.
In 2025, total absolute waste volume increased compared with the prior year, reflecting fleet growth. The recycling and reuse rate remained consistent year-on-year, demonstrating that waste management performance was maintained proportionally as the fleet expanded. This reflects stable waste management practices and the company’s ongoing commitment to circular economy principles.
| Waste volume (lts) per DWT | 2024 | 2025 |
|---|---|---|
| Total fleet | 0.87 (81 vsls) | 0.93 (83 vsls) |
| Containers | 1.07 | 1.07 |
| Bulkers | 0.33 | 0.4 |
Table 16: Total waste volumes per DWT for 2024-2025.
The detailed breakdown of waste handled through incineration, landfilling and other disposal methods is presented in the table below:
| Category | 2024 | 2025 |
|---|---|---|
| Total waste recycled/reused (m³) | 3,645.8 | 3,958.8 |
| Total waste disposed (m³) | 6,451.1 | 7,042.6 |
| Waste landfilled (m³) | 4,859.2 | 5,200.4 |
| Waste incinerated without energy recovery | 1,552 | 1,813.6 |
| Other / Waste with unknown disposal method (m³) | 39.9 | 28.6 |
Table 17: Total waste by treatment/disposal method (m³) for years 2024-2025.
The above table includes hazardous waste streams, such as jerrycans and paint cans, which are fully segregated and managed under strict handling procedures. While these waste streams are included in total waste figures to ensure completeness and consistency of reporting, they are also disclosed separately due to their hazardous nature.
Liquid waste primarily consists of oil residues (sludge) generated from fuel purification processes. Sludge volumes are closely linked to fuel consumption and are minimized through fuel quality analysis fuels in specialized laboratories and regular maintenance of purification systems. In 2025, total sludge generated amounted to 20,655 m³ and was disposed of at licensed shore reception facilities for further industrial processing.
All fleet vessels follow a specific Garbage & Sewage Management Plan (GSMP), while a Garbage Record Book and placards for the familiarization of crew and visitors regarding the proper handling of garbage on board are available. Ship personnel receive regular training on waste management procedures, and compliance is verified through internal audits, Port State Control inspections and port agencies/authority controls.
Onshore Waste Management
In parallel with shipboard management, we continuously strive to improve the management of waste generated in our headquarters. As part of our Environmental Action Plan, we monitor the average paper consumption per employee per day, and we always encourage our people to reduce paper consumption. Although the number of our personnel increased in 2025, the efforts for less paper use were noted. In 2025, total paper consumption decreased by 21.06%, compared to a 13.3% reduction in 2024.
At the same time, e-waste generation is of major concern. Danaos invests in high-end data and networking electronic equipment, attaining information security and prolonged life cycles. Any obsolete equipment, classified as e-waste, can either be in working condition or be unusable. IT equipment that remains in working condition after it has been data-wiped and refurbished is donated to charity institutions. Any equipment that we can’t re-use in-house is recycled by professional companies. Additionally, we abide by the contract with our suppliers to return IT electronic equipment and the empty toner cartridges for recycling. As a result of these practices, during 2025, a total of 415 kg of electronic IT equipment, 20 kg lamps and a total of 27 toner cartridges were collected from our offices for appropriate management and recycling.
Marine Environment Stewardship
Conforming to Environmental Laws & Regulations
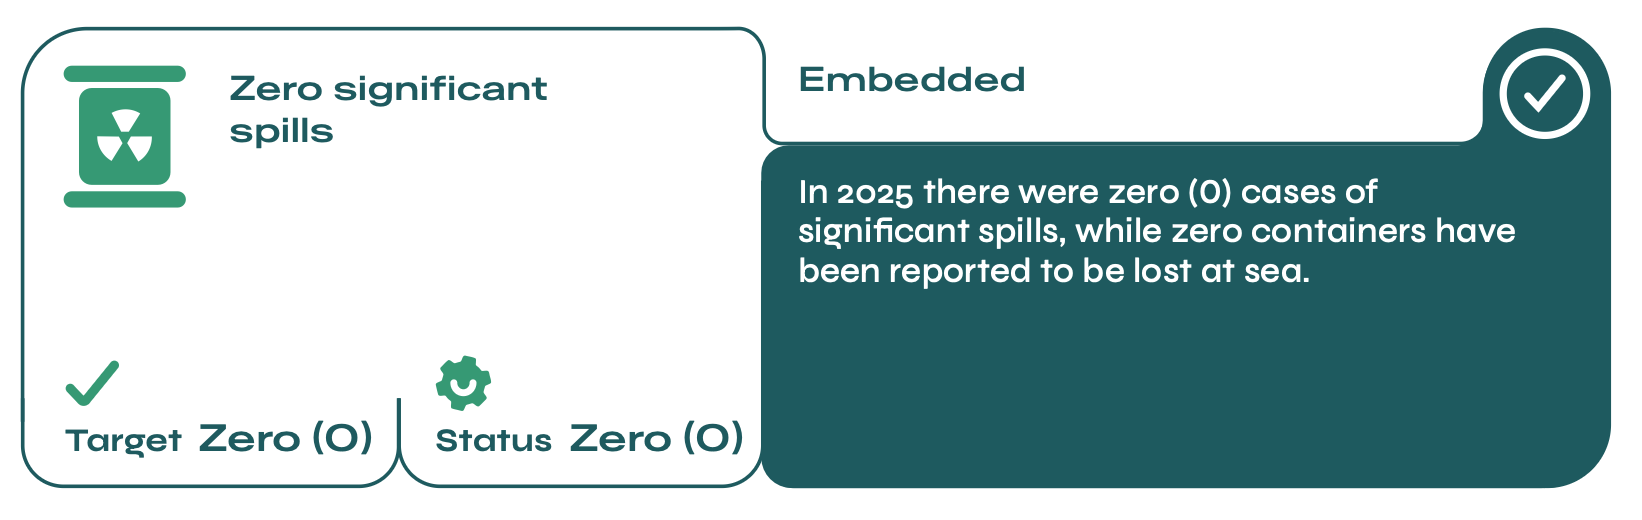
Environmental protection and pollution prevention remain top priorities for Danaos. The Company operates under a Zero MARPOL Incident policy, with any oil spill or leakage, regardless of scale, documented, reported and analyzed to prevent recurrence and continuously improve preventive controls.
Recognizing that human factors are the most common contributors to pollution incidents, Danaos focuses on minimizing exposure risks through a structured and proactive prevention framework. This includes preventive maintenance of critical machinery, routine drills and emergency simulations, and continuous training of both onboard and shore-based personnel through safety meetings and targeted programs and a strong crisis management policy. Danaos’ Safety Management System integrates robust pollution prevention procedures and crisis management protocols, supported by predictive risk assessments designed to identify and mitigate potential environmental threats before they materialize. These measures enable early detection, rapid response and effective incident prevention. As a result of this systematic approach, Danaos continues to operate with zero oil spills, reflecting the effectiveness of its governance structure, operational discipline and strong environmental culture.
At same time, we have established and implemented a robust Environmental Management System, and our fleet systematically complies with or exceeds environmental laws and regulations as imposed by:
- IMO
- U.S. Oil Pollution Act of 1990
- CERCLA (spills and releases of hazardous substances)
- Clean Water Act
- Clean Air Act
- EU MRV regulation
In 2025 there were zero (0) cases of significant spills, while zero containers have been reported to be lost at sea.
Biodiversity
Protecting Marine Biodiversity
Addressing biodiversity loss is a critical priority, given the close interconnection between healthy ecosystems, human well-being and maritime operations. Danaos applies sustainable shipping practices designed to minimize environmental impacts and protect marine ecosystems, including the reduction of pollutants, strict waste management controls and responsible operational planning.
To strengthen environmental governance, Danaos is developing a nature-related risk management process aligned with the Taskforce on Nature-related Financial Disclosures (TNFD) framework. This initiative will enhance the company’s ability to identify, assess and manage nature-related dependencies, risks and opportunities across its operations and supply chain. Risks are categorized by type, operational impact and timeframe, with defined mitigation actions aimed at safeguarding marine biodiversity while supporting operational efficiency and regulatory compliance.

To strengthen environmental governance, Danaos is developing a nature-related risk management process aligned with the Taskforce on Nature-related Financial Disclosures (TNFD) framework.
TNFD-aligned Nature-Related Risks and Opportunities
Physical Risks – Chronic
| Description | Primary Operation effect | Value chain stage where the risk occurs | Time horizon | Likelihood | Description of Countermeasure and Actions |
|---|---|---|---|---|---|
| Risks to Marine Habitats: Ship activity in Particularly Sensitive Sea Areas (PSSAs) may disrupt marine species habitat. Ship strikes are a major threat to many endangered whale species. Environmental hazards from underwater noise, which masks the communication signals of marine species and disrupts behavior of marine life. Risk of container loss overboard, resulting in marine pollution and long-term ecological harm. |
| Direct Operation, Downstream | MT | Low |
|
| Dependence on Biodiversity: Marine ecological degradation and sea-level rise may restrict access to key shipping channels and ports, leading to longer detours, higher fuel costs, schedule disruptions and reduced operational reliability. |
| Upstream, Direct Operation | LT | Low |
|
Policy and Transition Risks
| Description | Primary Operation Effect | Value Chain Stage | Time Horizon | Likelihood | Countermeasures |
|---|---|---|---|---|---|
| Ballast Water Management: Risk of invasive species through uncontrolled ballast water discharge and the transfer of non-native aquatic organisms to new marine environments, disrupting local ecosystems, harming biodiversity and affecting fisheries and coastal industries. |
| Direct Operation | MT | Medium |
|
| Ship Recycling: Improper ship recycling can result in severe environmental damage and legal liabilities. Ensuring compliance with international regulations, such as the Hong Kong International Convention and adhering to environmental protection standards is essential to mitigate this risk. |
| Direct Operation, Downstream | LT | Low |
|
| Biofouling Management: Extended anchorage during extreme weather may disrupt port operations and increase hull biofouling, reducing efficiency, raising fuel use and harming marine ecosystems. | Environmental pollution; Increased maintenance costs; Increased emissions; Reduced efficiency | Direct Operation | ST | Low | Implement proper biofouling management that minimizes environmental harm, while ensuring compliance with IMO and applicable environmental regulations. Apply Low Friction paints on all vessels, leading to significant power savings and subsequent reductions in carbon emissions, while reducing negative environmental impacts. |
| Waste Management: Improper handling of waste and plastics may lead to pollution into the marine environment, posing ecological harm and regulatory non-compliance. Implementing IMO-aligned systems and crew training helps prevent plastic discharge and maintain environmental standards. | Environmental pollution; Violations, fines; Navigational safety risks; Reputational risks | Direct Operation | MT | Medium | Install garbage compactors on all vessels to reduce the waste volume onboard. Onboard garbage is segregated under DSMS procedures, with separate waste streams and practices to prevent, reduce, recycle and safely discharge waste ashore, in compliance with international regulations. Training crew on proper garbage segregation and handling of waste to reduce impacts on the marine environment. |
Biodiversity Protection Opportunity
| Description | Primary Operation Effect | Value Chain Stage | Time Horizon | Likelihood | Countermeasures |
|---|---|---|---|---|---|
| Biodiversity Protection Opportunity: Leverage advanced route optimization and environmental data analytics to minimize whale strikes, reduce underwater noise and lower fuel consumption simultaneously. | Reduced impact on marine species; Reduced emissions | Direct Operation | LT | Low | Enhanced biodiversity protection and operational efficiency while lowering costs and supporting compliance with marine protection regulations. |
Table 18: TNFD-aligned Nature-Related Risks and Opportunities | ST: Short-term | MT: Medium-term | LT: Long-term
Key biodiversity protection measures include compliance with international regulation for ballast water. The BWTS units employed on all our vessels utilize either: UV disinfection, installed on our containerships, to inactivate bacteria and pathogens through ultraviolet light exposure, or Electrolysis-based treatment, installed on our bulkers, where seawater is electrochemically processed to generate disinfectant compounds that neutralize harmful organisms. 100% of Danaos’ diversified fleet of containerships and bulk carriers was retrofitted with BWTS, significantly reducing the risk of invasive species transfer while largely avoiding chemical discharge. The operation of BWTS is closely monitored, particularly in sensitive areas, in line with MARPOL guidance (MEPC.1/Circ.778). Additional measures supporting marine biodiversity protection include application of antifouling paints that are free of organotin compounds and cybutryne eliminating substances known to harm marine life, enhanced waste management practices, monitoring of freshwater consumption, recycling initiatives such as the mooring ropes recycling program and the Company’s 3R (Repair–Reuse–Recycle) policy. Sewage treatment systems are operated in compliance with applicable standards, while the company’s zero-spill policy, supported by continuous fleet monitoring and predictive maintenance, further reduces risks to the marine environment.
Danaos has established a structured action plan for oil spill risk mitigation, supported by preventive maintenance, regular drills, crew training and crisis management procedures. These measures protect not only the marine environment but also crew safety and surrounding communities. A robust Environmental Management System is in place, ensuring systematic compliance with, and in many cases exceeding, applicable environmental laws and regulations.
Further biodiversity-focused initiatives include the integration of environmentally sensitive areas into our advanced fleet monitoring system. Areas covered by initiatives such as “Blue Whales Blue Skies” and “SAvE Whales” are monitored using a geofencing-like approach, with voluntary speed reduction guidance communicated to charterers. Officers are encouraged to report encounters with cetaceans and other protected species to support awareness and mitigation efforts.
Biodiversity Protected Areas
| Biodiversity Protected Areas | Days in 2025 | % of Fleet Steaming Days |
|---|---|---|
| Whales Protected Areas | 1,014 | 4.6% |
Table 19: Days in Whales protected areas in 2025, based on total fleet steaming days
| Emission-sensitive Areas | Days in 2025 | % of Fleet Steaming Days |
|---|---|---|
| MARPOL ECA | 2,976 | 13.6% |
| NECA | 1,107 | 5.1% |
Table 20: Days in emission-sensitive areas in 2025, based on total fleet steaming days
In parallel, through our advanced analytics platform, Danaos closely monitors vessel operations within designated Sulphur Emission Control Areas (ECAs) and NOx ECAs, ensuring compliance with applicable emission limits and reducing air-pollution pressures on sensitive marine ecosystems.
Danaos recognizes that effective biodiversity protection requires sustainability to be embedded at all levels of the organization. Continuous training and awareness-building initiatives ensure that both shore-based employees and seafarers understand their role in protecting marine ecosystems and contribute to sustainable practices in day-to-day operations.

A robust Environmental Management System is in place, ensuring systematic compliance with, and in many cases exceeding, applicable environmental laws and regulations.
Further biodiversity-focused initiatives include the integration of environmentally sensitive areas into our advanced fleet monitoring system.
Monitoring and Compliance in Particularly Sensitive Sea Areas
As a tonnage provider, Danaos monitors our vessels’ activity in any sensitive areas and particularly sensitive areas as per MEPC.1/Circ.778/Rev.3 Annex 2, Page 1, through our online fleet monitoring system. More specifically, all Sensitive areas and Particularly Sensitive Areas are digitally mapped in our Beyond Waves analytics platform percentage of time spent in these zones is automatically calculated using real-time vessel coordinates as received from our online sensors and performance tools. In total, 1.5% of the operating time was spent in PSSAs within 2025. During operations in environmentally sensitive areas, Danaos ensures that vessel crews strictly follow all protective measures set out in MEPC.1/Circ.778/Rev.3 Annex 2, Page 1. These measures include enhanced reporting to relevant authorities, voluntary speed reduction, anchoring restrictions and the avoidance of activities that may increase environmental risk, such as cargo loading or unloading and bunkering.
Although Danaos’ operations predominantly take place in international waters, the Company maintains heightened oversight in Particularly Sensitive Areas (PSAs). In such regions, vessel activities are limited to transshipment only, with no cargo handling or bunkering permitted. This operational discipline minimizes environmental risk and reflects Danaos’ commitment to safeguarding vulnerable marine ecosystems while operating responsibly on a global scale.
As Danaos is not a liner operator and vessels are commercially operated by charterers, certain operational measures rely on close cooperation and awareness across the chartering chain. Voluntary initiatives, including speed reduction in sensitive areas and the prevention of illegal wildlife transport, are actively communicated and supported, with many of these commitments formally adopted by Danaos’ charterers.
Beyond operational controls, Danaos supports environmental protection through annual afforestation and coastal cleaning programs as well as active participation in HELMEPA (Hellenic Marine Environment Protection Association) initiatives. These actions contribute to environmental marine and coastal ecosystem protection, environmental awareness and broader community engagement.
Water Usage and Effluents Treatment
Water Used for Oceanic Operations
Danaos has established comprehensive procedures for managing water use and water discharges associated with ocean-going operations, fully aligned with International Maritime Organization (IMO) requirements and applicable local regulations. This proactive approach minimizes environmental impacts while ensuring consistent compliance with increasingly stringent global standards.
Recognizing the diversity of ship-generated water streams, Danaos applies a structured risk-management framework to identify, assess and mitigate potential impacts on the marine environment. Water-related risks are integrated into operational planning and monitored through onboard systems, inspections and audits.
The Company’s policy on the prevention of pollution from sewage generated onboard its vessels is based on the following core principles:
- All sewage equipment on board the Company’s ships is type approved as indicated by a maker’s plate affixed to the equipment and are approved by the Flag Administration.
- Vessels equipped with sewage holding tanks should use these tanks in all ports and following MARPOL Guidelines, dispose of the contents further than 12 miles from nearest land and in accordance with the approved discharge rate.
- Treated sewage along with greywater can be temporarily disposed through Class approved piping to designated temporary holding tanks and thereafter discharged to the stringiest regulation applicable.
- Vessels equipped with chemical treatment plants should be used while in transit throughout all coastal areas.
Shipboard wastewater management is governed by the Garbage & Sewage Management Plan (GSMP), which incorporates all applicable IMO and national regulations. The GSMP clearly defines roles and responsibilities for sewage management and sets out best practices for the safe and efficient operation of sewage treatment plants. Periodic maintenance, inspections and performance checks are integrated into the Planned Maintenance System (PMS).
In addition to the assigned personnel’s specific duties familiarization, all shipboard personnel are further trained and educated during the regular safety and environmental meetings held on board on the following topics:
- International (MARPOL Annex IV) and national legislation of the States/ports called.
- Specific requirements for wastewater treatment and disposal of wastewater effluents.
- The operation of wastewater treatment facilities onboard.
- The disposal of wastewater to shore facilities.
- Health and sanitary considerations, best practices to avoid abnormalities to sanitary system onboard.
For operations in U.S. waters, Danaos complies fully with the Vessel General Permit (VGP) requirements for greywater discharges. VGP controls have been embedded into the Danaos Safety Management System (DSMS), supported by a dedicated onboard manual and computer-based training (CBT) modules to ensure crew awareness and compliance.
Water stewardship is also extended to the supply chain. The ESG Supplier Assessment program includes dedicated water-related disclosures within the ESG Questionnaire, encouraging suppliers to report on water consumption and effluent treatment practices and supporting responsible value-chain engagement.
Ballast Water
As ballast water operations represent a material interaction with marine ecosystems, Danaos applies strict controls to minimize the transfer of invasive species. The company began installing Ballast Water Treatment Systems (BWTS) in 2018, and by the end of 2025 100% of the fleet was fully equipped and operational, irrespective of IMO compliance dates.
UV-based treatment systems are installed on all containerships, eliminating bacteria and pathogens without the use of chemicals, while electrolysis-based systems are applied on bulk carriers to ensure robust performance under varying operational conditions. All engineering, approvals and installations were conducted in-house by the R&D and Technical Departments, following rigorous evaluation criteria including efficiency, durability, operational flexibility and environmental performance. All systems are certified by the IMO and approved by the U.S. Environmental Protection Agency and relevant European authorities.
In 2025, the total volume of ballast water that was operated through BWTS in Danaos’ fleet was slightly increased to 12,653,487 cubic meters, corresponding to 3.1% increase compared to previous year. The increase is primarily attributable to fleet expansion, with additional vessel capacity delivered during the period (2 container vessels were delivered in 2025). Total ballast treated is related to the total number of vessels of the fleet as well as the diversification of the fleet and is expected to increase along with the fleet growth. We should mention that we aim to optimize the use of ballast water equipment and, whenever possible, we perform ballast operations by gravity to reduce fuel consumption.
Discharged ballast water is tested on an annual basis for all Danaos vessels. Samples are tested annually regardless of VGP port calls in order to verify system operation and proper discharge properties. Within 2025, a total of 79 samples have been tested and all found within limits.
| Ballast Water | 2024 | 2025 |
|---|---|---|
| Total Ballast Operated (m³) | 12,270,328 | 12,653,487 |
| Ballast operated compared to last year | 127% | 3.1% |
| Change in FO consumption per ton of ballast operated compared to last year | 134% | 9.7% |
Table 21: Ballast Water for 2024-2025.
Scrubber discharge water is tested in all vessels of our fleet that are equipped with open loop scrubber. As per VGP, washwater sampling from 3 positions shall take place twice during the first year of permit coverage or system operation, whichever is later. The two samples must be collected at least 14 days apart, while -as per IMO requirements- sampling should take place only during system testing (commissioning) and at a 12-month interval for a period of two years of operation (minimum 3 samples). Apart from the standard VGP requirement, Danaos requires that washwater is tested on an annual basis, in order to verify system operation and that the discharged water is within the permissible limits. Within 2025, a total of 25 samples have been tested and 24 found within limits. Resampling was carried out as a corrective action for the one out-of-limits test from washwater samples, to ensure proper operation of system. The resampling results were found to be within limits, too.
Freshwater Use
Freshwater availability is an increasingly material environmental issue, and Danaos recognizes that effective water management supports operational resilience, cost efficiency and preparedness for future regulatory developments. Accordingly, Danaos has implemented a structured program to monitor and report freshwater withdrawal and consumption across both fleet and shore-based operations.
Water use at the Company’s headquarters has been actively monitored since 2023, and in 2024 this initiative was expanded to cover all office locations (5 offices and 1 site office in S.Korea). Freshwater for shore-based operations is sourced exclusively from public water supply networks.
During 2025, freshwater withdrawal and consumption at the headquarters amounted to 1,048 mt, reflecting an increase compared to the previous year by 29%, primarily attributable to business growth and an increase in personnel. Wastewater generated at shore offices originates solely from domestic water use. As the effluent is discharged directly into public wastewater drainage system, in line with local legislation and specifications, volumes cannot be separately measured. At the headquarters in Greece, wastewater management is handled entirely through the municipal wastewater collection and treatment infrastructure operated by local authorities, where all discharges are managed in compliance with applicable national and local environmental regulations.
To strengthen its understanding of water-related physical risks, Danaos conducts a physical water risk assessment across its global office locations using the WWF Water Risk Filter Tool, considering factors such as water availability and exposure to physical water stress.
For shipboard operations, freshwater consumption is mainly supported by onboard desalination units, which supply the majority of fresh water used during voyages. Freshwater supplied from shore facilities therefore represents only a limited proportion of total onboard consumption. Any necessary replenishment is mainly conducted in ports located outside water-stressed areas, except in emergency or safety-critical situations, ensuring minimal impact on local communities and ecosystems.
Awareness training on water efficiency and conservation is provided to employees and crew, emphasizing responsible freshwater use in water-stressed areas and compliance with environmental requirements.
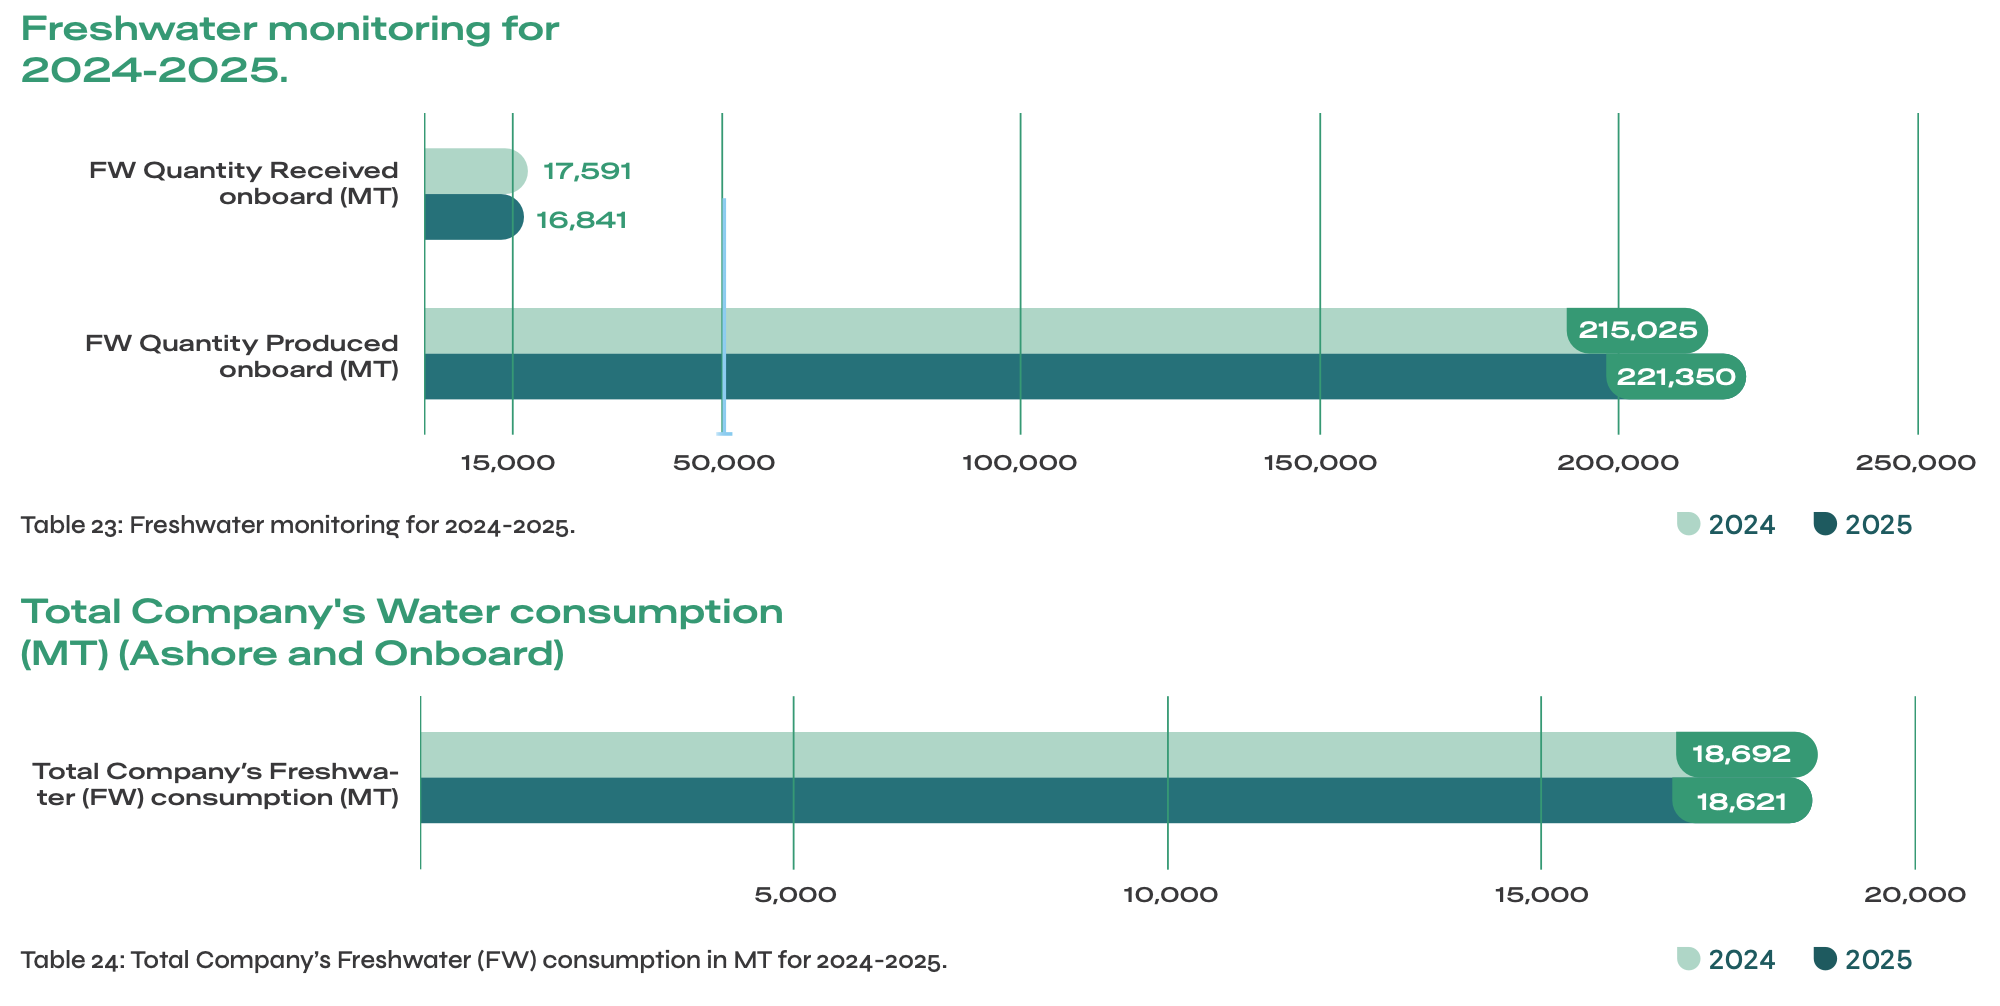
In 2025, 16,841 metric tons of fresh water were received onboard vessels. Total freshwater consumption is closely linked to fleet size and operational activity, and absolute volumes are expected to increase in line with fleet growth.
| Offices FW consumption – total volumes (MT) | Year | HQ | All offices |
|---|---|---|---|
| 2024 | 813 | 1,101 | |
| 2025 | 1,048 | 1,780 |
Table 22: Offices Freshwater consumption for 2024-2025.
Freshwater consumption onboard is monitored on a quarterly basis by our SQE department, through vessel-level reporting by consumption category. A daily average freshwater consumption indicator has also been incorporated into the monitoring framework to enhance trend analysis and operational oversight.
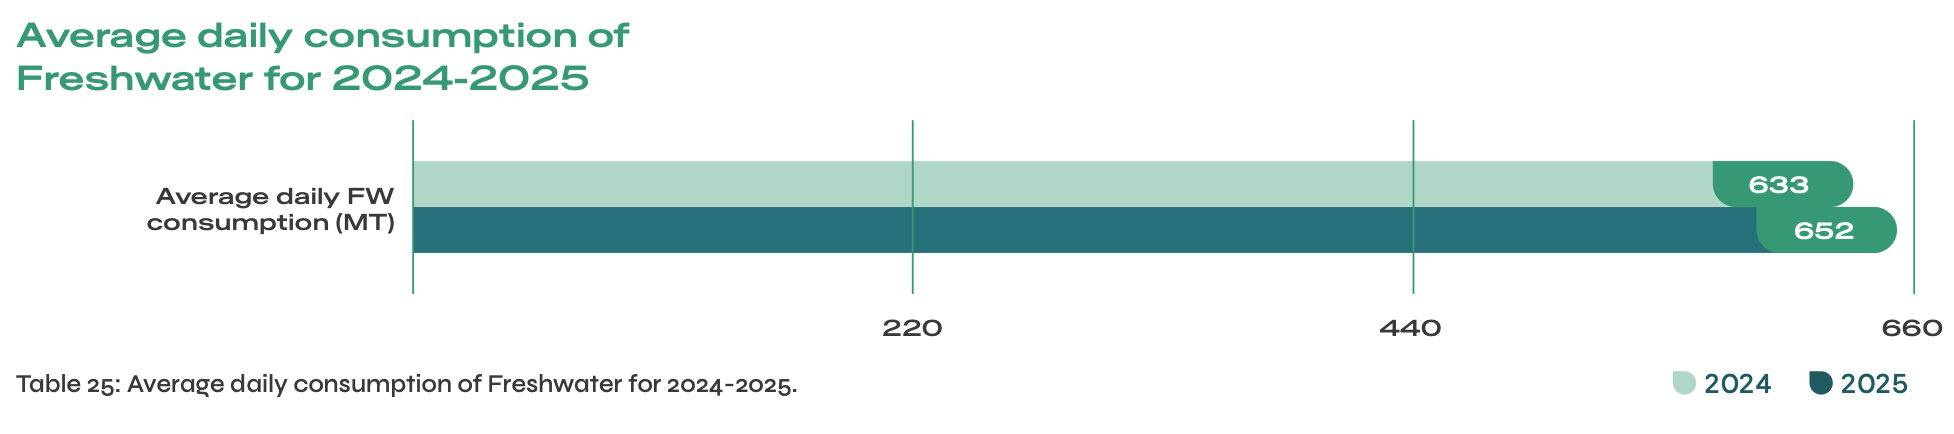
To safeguard crew health and wellbeing, Danaos conducts systematic potable water quality testing in accordance with the Maritime Labour Convention (MLC, 2006) and World Health Organization (WHO) drinking water guidelines. The Maritime Labour Convention (MLC 2006), which came into force on August 20, 2013, demands that Potable (Drinking) Water should be tested (in accordance with World Health Organization guidelines for drinking water quality) at least once, at intervals of not more than six (6) months. Every vessel submits 2 samples on an annual basis, from different onboard locations. Within 2025, a total 168 samples were sent for analysis and 155 were found within limits. Where deviations were identified, corrective actions including resampling were promptly implemented, with results confirming compliance.
Through continuous monitoring of freshwater withdrawal, consumption and quality, and by assessing physical water risks across shore-based operations, Danaos reinforces responsible water management and supports the sustainable operation of its fleet and offices.
EU Projects
For one more year we are at the forefront of maritime research, continuously advancing energy efficiency, digital transformation, and sustainability. DT4GS, EO4EU, Engimmonia, and ongoing AutoAssess, Eco-shipyard, SafeNav, BlueBarge, Copropel, and Reship projects were completed embody our commitment to cutting-edge solutions. From AI-driven autonomous inspections and digital twin ecosystems to next-generation propulsion systems and sustainable shipyard operations, these projects integrate big data analytics, IoT, generative AI, alternative fuels evaluation, to enhance vessel performance and reduce environmental impact. Building on the success of last year’s completed initiatives within the context of Bugwright2, Emerge, Gaters, and E-Shyips, we continue to drive progress toward a greener, more efficient maritime industry.
Completed projects
DT4GS – Digital Twin for Greener Shipping
Within 2025 DT4GS (Digital Twin for Greener Shipping) has been successfully completed pushing the boundaries of Digital Twin technology in maritime operations, ensuring enhanced vessel monitoring, predictive maintenance, and decision support. In the context of the project, we demonstrate a cutting-edge digital twin ecosystem designed to enhance efficiency, optimize decision-making, and drive the industry’s decarbonization efforts. The DT4GS frame represents a holistic modular DT frame comprising a variety of services and simulation tools, fostering operational efficiency and environmental compliance.
At its core, the Open Model Library (OML) provides a standardized repository of simulation models, ensuring interoperability and scalability across various optimization scenarios, thereby enabling stakeholders to develop and deploy, on demand, tailored solutions with ease.
The Operational Optimization Digital Twin (OODT) functions as an intelligent engine for voyage planning, integrating Agentic AI and reinforcement learning to enhance routing strategies dynamically. These AI-driven models continuously adapt to changing conditions, balancing emissions reduction, regulatory compliance, cost efficiency, and safety, making way for more autonomous and self-optimizing maritime operations.
The seamless integration of OODT with the Dataspace ensures secure and real-time data exchange, fostering an ecosystem where vessels, ports, and logistics networks operate with synchronized intelligence. The Knowledge Graph plays a pivotal role in standardizing data relationships and automating KPI identification, enabling predictive analytics and proactive decision-making. These advancements collectively pave the way for controlled automation and autonomous shipping, where real-time adjustments and AI-driven decision support systems reduce human intervention while maintaining regulatory and operational oversight. The inclusion of control actuation mechanisms ensures that AI-optimized decisions can be directly executed on vessel navigation, fuel management, and port call coordination, accelerating the transition toward smarter, semi-autonomous shipping operations.
Finally, the introduction of the DT4GS Alliance aims to realize the vision of a collaborative initiative involving key industry players and technology leaders, fostering innovation, knowledge exchange, and standardization within the digital twin landscape. Through coordinated efforts, DT4GS ensures that emerging technologies, such as AI-enhanced optimization and autonomous decision-making, align with industry needs and regulatory frameworks. Furthermore, the significance of digital twins in modern maritime operations has been extensively documented in the “Shipping Digital Twin Landscape” chapter, published by IGI Global. This publication highlights the transformative potential of digital twins, illustrating how frameworks like DT4GS contribute to sustainability, efficiency, and automation in the maritime sector. By integrating these elements, DT4GS not only enhances current operational strategies but also lays the groundwork for the next generation of autonomous and intelligent shipping solutions.
EO4EU
EO4EU advances AI-driven methodologies for managing Earth Observation data, improving accessibility and utilization for maritime applications and environmental monitoring. EO4EU aims to limit the solution space and increase the throughput reducing the computational time. Such an approach will have a positive impact on ships travelling, towards their destination, as it will limit the time of the optimized route. EO4EU offers enhanced visualization capacity of the data obtained both by the open EO sources as well as the in-situ data collected by DANAOS, offering a multi-layer interaction with the user on board, while augment user-friendliness and responsiveness.
ENGIMMONIA
The ENGIMMONIA Project received significant recognition at the Waterborne Days 2025, where it was honoured with two prestigious awards: the Outstanding Innovation Award and the Environmental Impact and Climate Change Award. These accolades highlight the project’s ground-breaking contributions to advancing sustainable fuel technologies in maritime operations.
ENGIMMONIA focuses on integrating ammonia as a maritime fuel, accelerating the transition toward zero-emission shipping while incorporating innovative waste heat recovery and renewable energy integration technologies.
Danaos’ active participation in ENGIMMONIA aligns seamlessly with its strategic goal of fostering innovation in the pursuit of a greener, more sustainable future. By supporting the development and implementation of eco-friendly fuel solutions, Danaos reinforces its commitment to reducing the environmental impact of maritime activities, thus shaping a more sustainable and climate-conscious industry.
Ongoing projects
As part of the awarded CoPropel initiative, Danaos is exploring the application of composite material technology in the design of next-generation marine propellers, significantly enhancing propulsion efficiency while reducing noise and weight. A key ambition of CoPropel is the development of a composite marine propeller integrating an embedded structural health monitoring (SHM) system. Through a pyramid-style demonstration strategy, the project progresses from coupon-level testing to small-scale prototypes and ultimately full-scale sea trials, raising the technology readiness level to TRL 5–6. In parallel, existing composite propeller design and certification guidance is being updated to support future market deployment.
In the context of digital transformation, Danaos plays a key role in AutoAssess, a revolutionary initiative aimed at leveraging AI-driven autonomous inspections to enhance ship safety and maintenance efficiency. AutoAssess utilizes unmanned aerial systems (UAS) equipped with AI-based scanning, mapping, navigation, and non-destructive testing (NDT) to autonomously inspect and assess ships in environments where traditional GNSS-based navigation is ineffective. By integrating cutting edge multi-modal SLAM, path planning, and machine learning for defect identification, AutoAssess significantly reduces the need for human intervention, ensuring a safer and more efficient inspection process.
Through a digital twin approach, this project achieves superhuman results, offering high-resolution 3D mapping, defect detection at the micrometer scale, and automated trend analysis for predictive maintenance. We also actively involved in projects dedicated to increasing ship performance, improving energy efficiency, and fostering value chain integration.
Within ESY Ecoshipyard, we are committed to fostering sustainable shipyard operations by integrating green technologies that minimize environmental impact. The project provides shipyards with a cloud-based platform for continuous monitoring, assessment, and ranking of sustainability options, incorporating AI-driven quality control, predictive maintenance, and optimized design methodologies.
SafeNav enhances navigational safety with AI-driven real-time obstacle detection, utilizing state-of-the-art sensor data and advanced decision-support algorithms to reduce collision risks and ensure safer maritime operations.
In BlueBarge, we are driving the development of sustainable and energy-efficient shipping through modular and scalable offshore power supply solutions that mitigate emissions from moored and anchored vessels.
In Reship, we are involved in redefining energy efficiency solutions for Hydrogen – powered ships, contributing to the development of energy-saving devices and hydrogen-compatible solutions for marine and inland shipping.
2025: Expanding our Portfolio
As we step into 2025, our portfolio is significantly enriched with new impactful EU-funded projects, showcasing our commitment to advancing maritime technology and sustainability. Our D-Navio, Mediate, and Warrant are set to revolutionize the maritime industry by incorporating cutting-edge technologies such as AI Digital Twin, Zero-Trust principles, IoT, Federated Learning, and MCDA.
Innovation and Digitalization
Shipping companies are continuously seeking ways to adopt new technologies and enhance the efficiency of their investments. As global supply chains demand a smooth flow of goods and services, Digital Business has become a crucial enabler for shipping companies. Modern technologies, such as the Internet of Things (IoT), Big Data, Artificial Intelligence (AI), Application Programming Interfaces (APIs) and sensors, along with large volumes of data, are being harnessed to optimize operations, boost efficiency and lower costs. In order all of these to be implemented, changes in the operating models are required as soon as possible for the whole industry to adapt to the new demanding reality.
To successfully implement these advancements, operating models must evolve rapidly, enabling organizations to adapt to a more data-driven and demanding business environment. During 2025, the Company significantly accelerated its digital transformation journey through the implementation of the following innovation initiatives at its Beyond Waves platform:
Digital Finance & Cost Management
Invoices Manager & AI-Driven Invoice Processing
A centralized operational hub was introduced for invoice uploading, management, monitoring, approval, and payment processing. AI-enabled invoice uploading automates data capture and reduces manual intervention, improving accuracy and efficiency.
Key components include:
- Invoices Approval Rules Engine, enabling the modelling of complex approval workflows and strengthening internal controls.
- Expanded Expense Ledger Editor tool
- Subscriptions Log, a centralized monitoring tool
- Currencies API, replacing manual exchange-rate entries with automated online data integration
- Digital Cash Expenses Report, enhancing transparency and traceability of operational cash expenses.
Departmental Budget Platform
A unified system for the structured preparation and management of annual departmental budgets was deployed. The platform ensures:
- Controlled and standardized budget planning,
- Alignment with financial reporting and accounting standards,
- Full integration with the Company’s accounting framework,
- Improved financial oversight and accountability.
Operational & Travel Digitalization
Crew & Ticketing Management Platform
A centralized and secure digital flight-booking platform was implemented to support business travel and crew movements.
The system operates as a bidding platform where multiple travel agents submit quotations, enabling:
- Faster comparison of travel options,
- Streamlined workflows,
- Transparent cost control,
- Improved operational efficiency.
Chartering & Commercial Data Governance
Time Charter Descriptions Management Tool
A new digital workflow empowers designated data owners to independently maintain and update chartering information, subject to internal approval processes. The solution enhances:
- Data accuracy and accountability,
- Reduced maintenance effort and response time,
- Continuous management visibility over chartering descriptions and related decisions.
Hearing Crew's Voice – Digital Feedback Framework
A structured digital feedback ecosystem was introduced to ensure that seafarers’ perspectives are systematically captured and incorporated into decision-making processes. This includes:
- Crew Survey Questionnaire, enabling regular and anonymous feedback collection regarding onboard conditions, wellbeing, and operational practices.
- LTP (Learning & Training Program) Questionnaire – Online, allowing crew members to evaluate training effectiveness and identify development needs, supporting continuous professional improvement.
- Crew Welfare Inventory Management.
- Accommodation Inspection Checklist & Aggregator
These tools promote open communication, strengthen trust, and enable management to proactively address emerging concerns.
Fleet Performance & Operational Intelligence
Fleet Performance Monitoring Tool
A fleet-wide performance evaluation system was introduced, providing:
- Monitoring based on key operational parameters,
- Comprehensive visibility into vessel condition and performance trends,
- Summary dashboards comparing vessel performance against Charter Party benchmarks, supporting improved operational efficiency and fuel optimization.
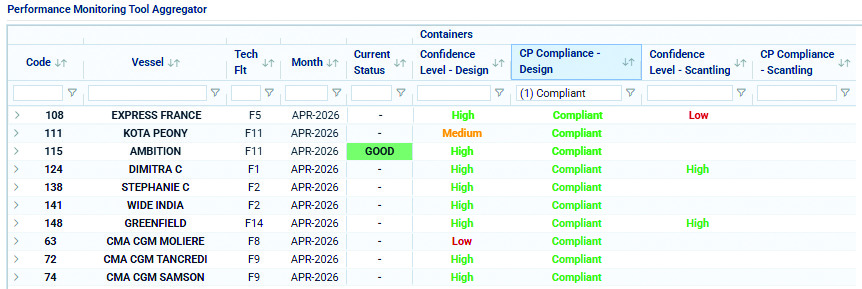
Departmental KPI Monitoring
Integrated KPI dashboards now provide consolidated visibility across crew, operational, and technical performance areas. This enables:
- Early identification of trends, inefficiencies, and operational risks,
- Improved planning and compliance monitoring,
- Enhanced fleet-wide resource allocation and decision-making.